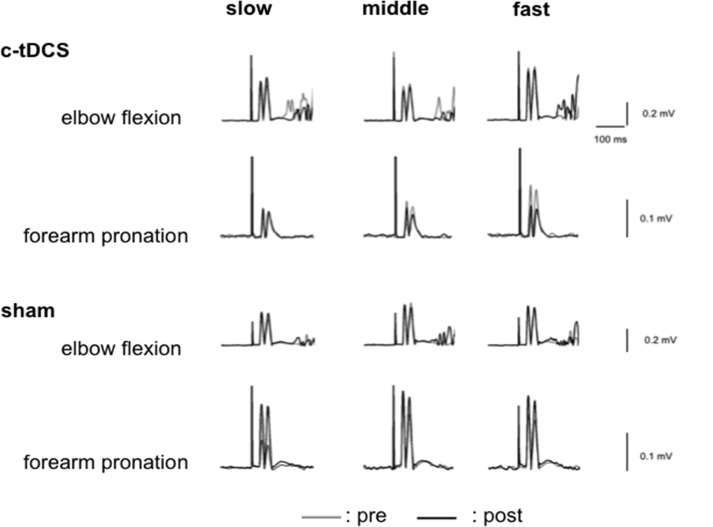
Fig 4. Examples of motor evoked potentials in left biceps brachii.
Averaged rectified typical MEP waveforms (10 trials of each) recording from left BB prior to elbow flexion or forearm pronation in c-tDCS or sham sessions of a representative participant. The gray and black traces indicate pre and post c-tDCS or sham, respectively. Slow, middle and fast indicate 0.75, 1.0 and 1.25 Hz, respectively.

