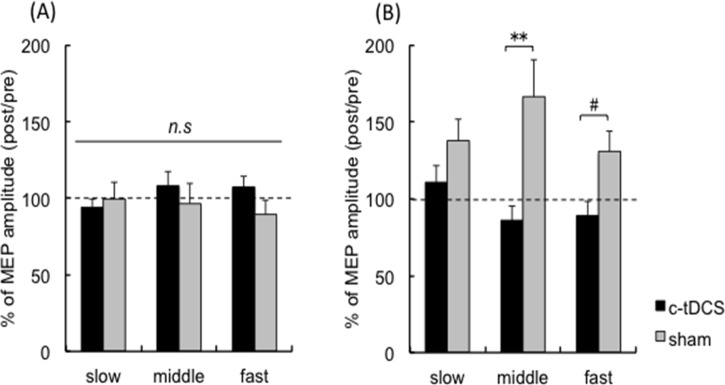
Fig 5. Analyses of left biceps brachi motor evoked potential amplitude.
Group average BB MEP amplitude (post/pre) (n = 17) for the c-tDCS (filled bar) and sham (gray bar) sessions during (A) elbow flexion and (B) forearm pronation tasks. Error bars indicate SE. # p = 0.068; **p < 0.01. Slow, middle and fast indicate 0.75, 1.0 and 1.25 Hz, respectively.

