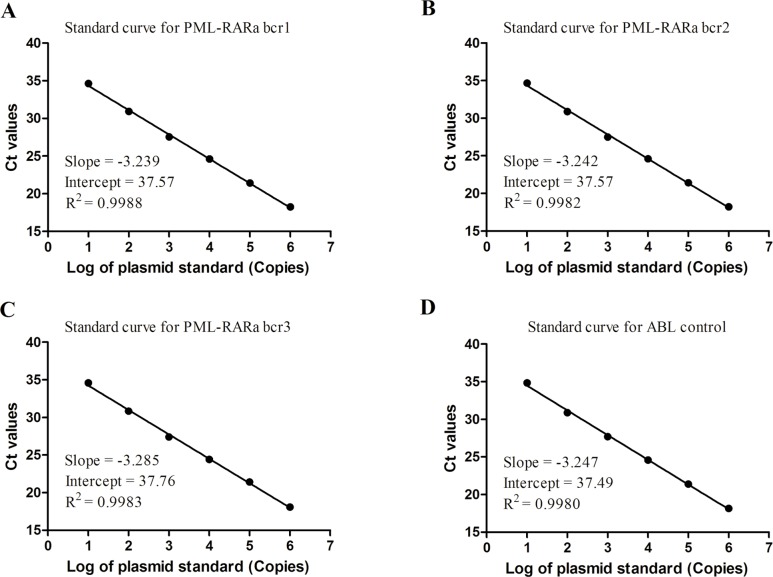
Fig 2. Standard curve for PML-RARa bcr1, bcr2, bcr3 and ABL control gene.
(A) Standard curve for PML-RARa bcr1. (B) Standard curve for PML-RARa bcr2. (C) Standard curve for PML-RARa bcr3. (D) Standard curve for ABL control. The range on all curves is from 106 to 10 copies of corresponding plasmids. The efficiencies of PML-RARa bcr1, bcr2 and bcr3 were found to be similar to that of ABL, with slope values much closer to -3.32 (the slope associated with a PCR reaction with maximal efficiency).

