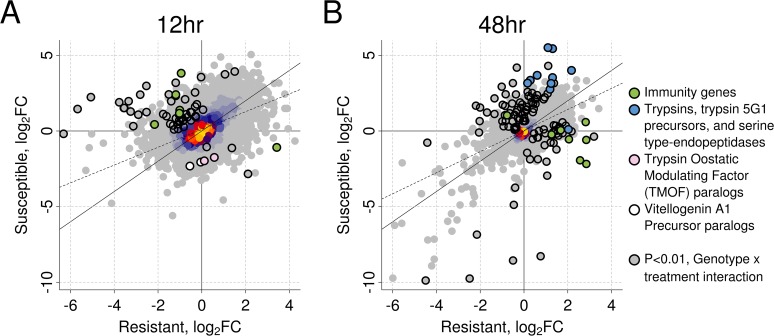
Fig 3. The induced response to B. malayi is highly correlated between resistant and susceptible mosquitoes.
The correlation in log2 fold change between infected versus uninfected mosquitoes is shown at (A) 12 hours (Pearson's R2 = 0.51) and (B) 48 hours (Pearson's R2 = 0.58) post infection for resistant and susceptible mosquitoes. The genes highlighted with black circles differ in the direction or magnitude of expression (interaction term significant at a P<0.01). The black diagonal line shows the relationship expected with a perfect correlation, and the dotted line shows the best fit line from the observed data. Warmer colors (uncircled) indicate a higher density of superimposed points.

