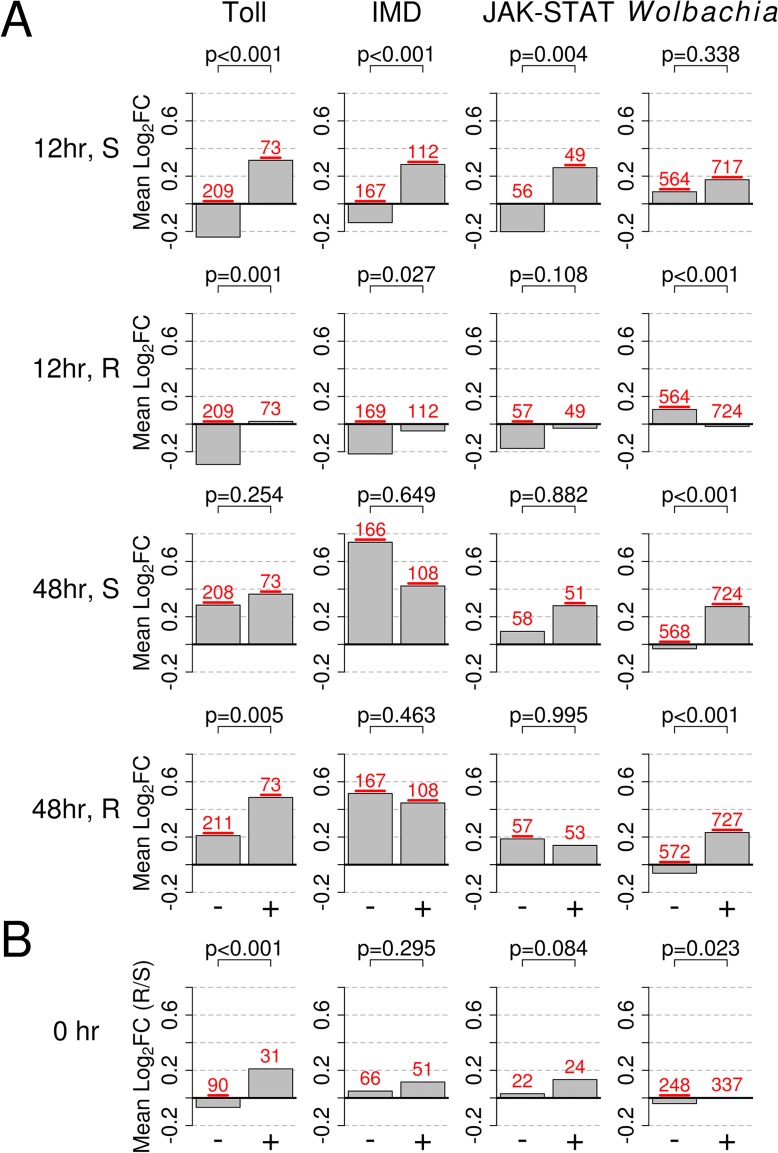
Fig 5. Response to infection of genes in the Toll, IMD, or JAK-STAT pathways, or those responsive to infection with Wolbachia strain wMelPop-CLA.
The bars show mean log2 fold change in expression (Mean Log2FC). + or - indicates genes that are upregulated or downregulated by the category shown at the top of each column and were obtained from [43–45]. A) Expression changes in response to B. malayi in susceptible and resistant genotypes at 12 and 48 hours after infection. B) Constitutive expression of pathways prior to infection (0 hr; resistant versus susceptible), with positive values indicating higher expression in the resistant genotype and vice versa. In B), only genes mapping to the second and third chromosomes, which are not biased with regards to sequence mapping, are shown. The numbers of genes in each category are shown is red above each bar and are underlined if their mean is significantly different from 0 (t-test, P<0.05). P-values from a Mann-Whitney test comparing up and down regulated genes are shown above each bar plot.

