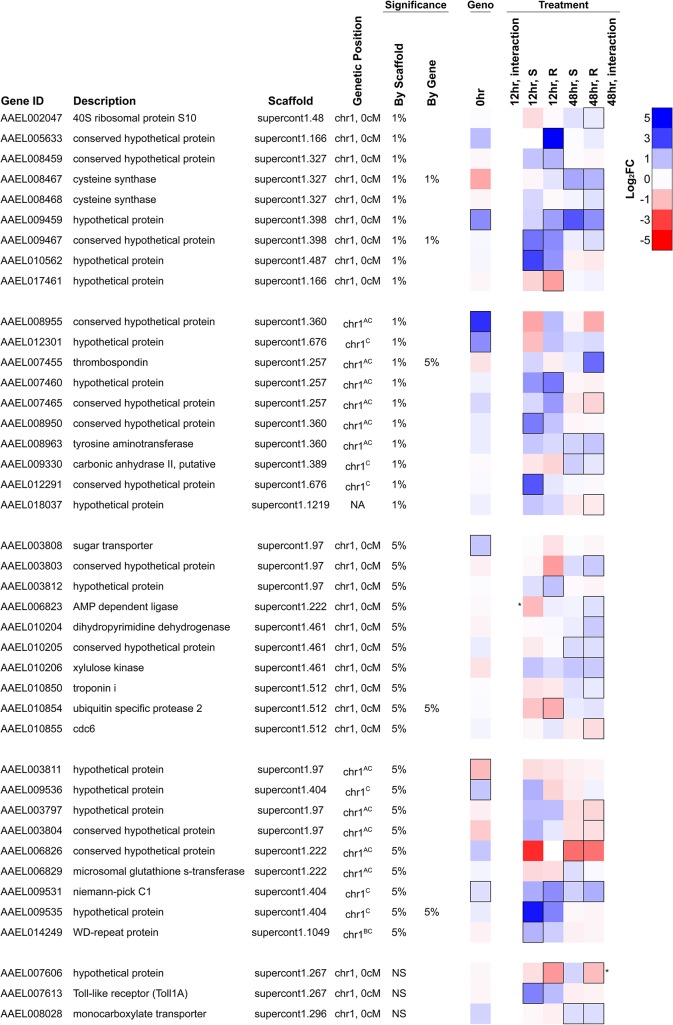
Fig 6. Differentially expressed genes in the genomic region controlling resistance.
Genes shown either map to the genetic map position associated with resistance (chromosome 1, 0 cM) or are on an unassembled scaffold with a significant association at a genome-wide significance of P<0.01. They are significantly differentially expressed either 1) between resistant and susceptible genotypes prior to infection (FDR<0.20; black border) or 2) in response to infection in either genotype at 12 or 48 hours after infection (FDR<0.20; black border), or 3) respond to infection differently between the genotypes (* indicates a significant interaction between genotype and infection at P<0.01). Several genes have been assigned to chromosome 1 but have an unknown genetic map position. AOn a misassembled scaffold, BMapped to chromosome 1 previously without positional information [19], CNewly mapped to chromosome 1 using F ST estimates from RNA-seq data. NA indicates no genetic mapping information.

