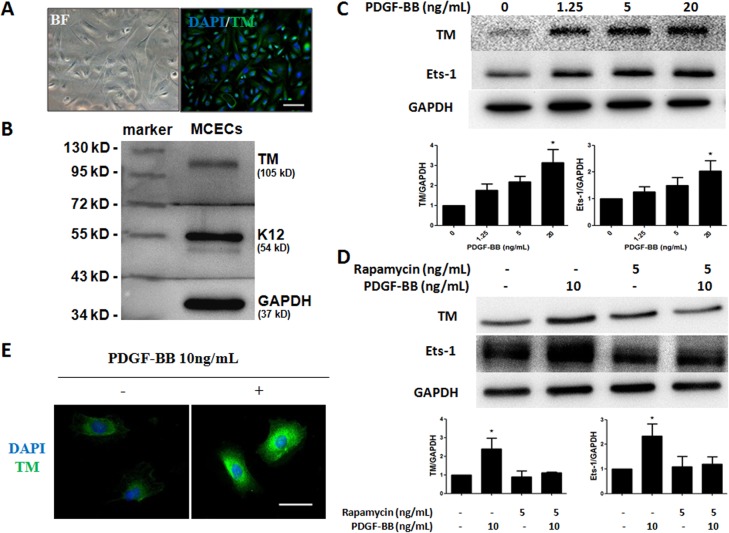
Fig 4. PDGF-BB stimulates TM expression in MCECs and HCECs.
(A) TM expression was investigated by immunofluorescence staining. Primary MCECs were cultured in CnT-50 medium. The cells were stained by DAPI (blue) and TM (green). BF, bright field. (B) Western blot analysis of TM. MCECs lysates were analyzed by Western blot with antibodies against TM and K12. (C) HCECs were treated with various concentrations of PDGF-BB for 6 h. Expression levels of TM and Ets-1 were analyzed with Western blot and normalized by GAPDH. Western blots from three independent experiments were analyzed by densitometry. The indicated fold changes represent the density relative to control (0), * p < 0.05 compared with 0 ng/mL PDGF-BB. (D) Quiescent MCECs were treated with rapamycin (0 or 5 ng/mL) for 60 min, followed by 6 h of PDGF-BB treatment. Expression levels of TM and Ets-1 were analyzed with Western blot and normalized by GAPDH. Western blots from three independent experiments were analyzed by densitometry. The indicated fold changes represent the density relative to control (-),* p < 0.05 compared with 0 ng/mL PDGF-BB and rapamycin. (E) Immunofluorescence staining of TM in MCECs with or without 10 ng/mL PDGF-BB treatment for 6 h. Data represent means ± SD. TM (green), DAPI (blue). Magnification: 200×. Bar = 100 μm.

