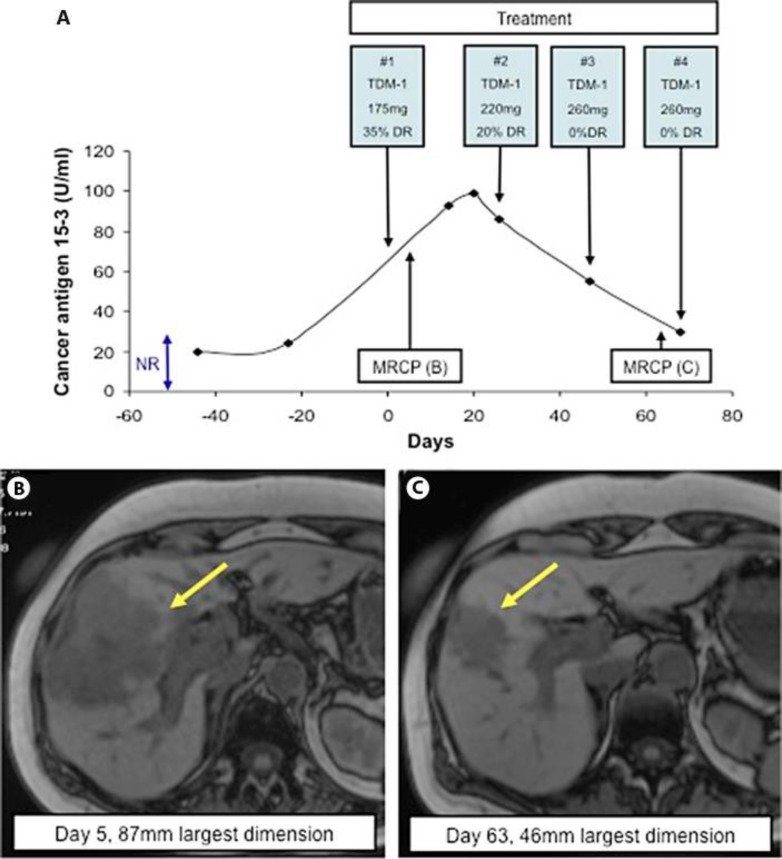
Fig. 3.
CA15–3 and radiological response to treatment with TDM-1. Changes in CA15–3 (U/ml) were recorded in response to treatment (A). The normal range (NR) for CA15–3 is <28 U/ml. Each cycle of TDM-1 treatment is shown along with its cycle number, dose and any dose reduction instituted. Day 0 represents the administration of the first cycle of TDM-1. MRCP was performed at baseline (B) and after administration of 3 cycles of TDM-1 (C) to monitor radiological response of the metastatic deposit (yellow arrows).

