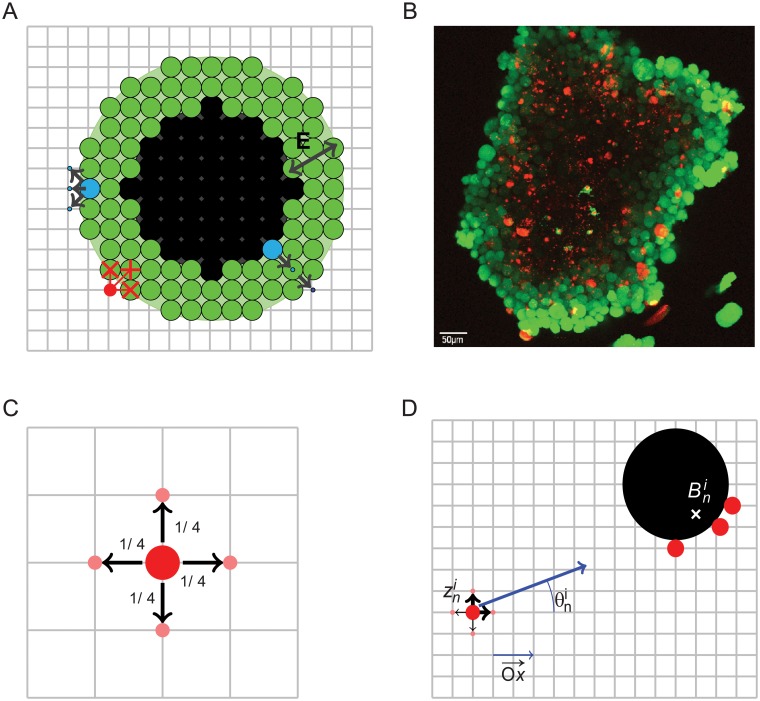
Fig 1. Graphical representation of the model.
(A) Synthetic planar structure of the nodule, fitted to the grid. Green: cells in the proliferative shell. Black: non proliferative and necrotic cells.: CTL killing its -neighborhood tumor cells. Blue: two tumor cells attempt to divide. On the left, a tumor cell is dividing towards one of the three free available positions (black arrows). On the right, there is no free location available at the time of division, the dividing cell pushes its close neighbors towards the exterior of the nodule. (B) Picture of a melanoma nodule. Green: alive cells, red: dead cells. (C) Random walk on the 2D grid of one CTL. Red: position of the CTL. Black arrows: admissible displacements. (D) One CTL at position is attracted by 3 scout sibling CTL (in red) that have hit the tumor nodule (black sphere). The barycenter is the target position for . The random walk of CTL on position is reinforced towards (blue arrow), please see material and methods section for further details.

