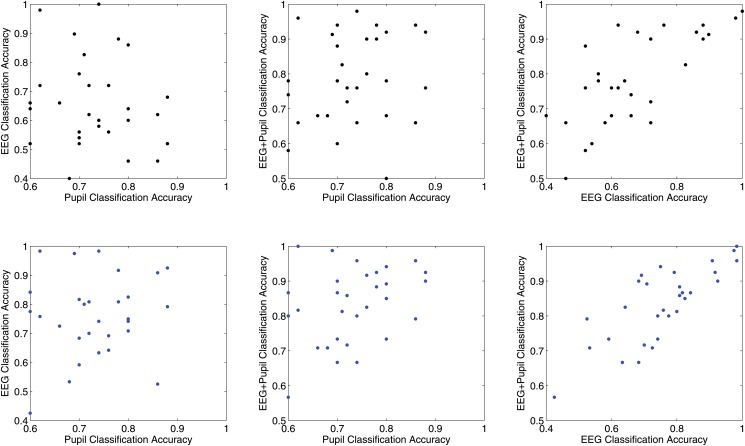
Fig 6. Scatter Plots of Correlation Analysis Between Different Classification Feature Sets.
The Figure illustrates in the top row with black dots the classification accuracy with the separate training and test set approach and in the bottom row with blue dots the classification accuracy with the cross validation training approach.

