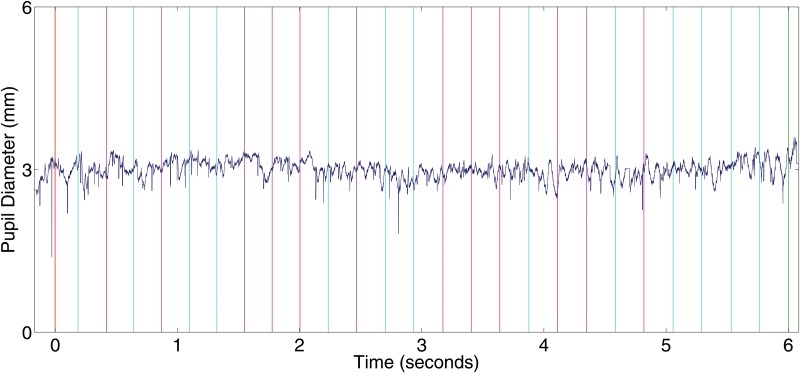
Fig 7. Pupillary Diameter Time Course for a Single User During an Entire 5 Minutes Block.
The Figure illustrates the inherent noise of the signal and the difficulty to discern patterns of motor imagery by pupil dilation with the naked eye. Trial classes (left hand imaginary movement and nothing condition) are marked in the Figure as pink and cyan vertical bars respectively. The beginning of the experiment is marked with a red vertical line. The end of the experiment is marked with a vertical green line. Notice that the second half of the interval between vertical bars corresponds to the micro-break given after the auditory stop cue within each trial and hence it was not used in the calculation of the average pupil diameter.

