
Figure 3.
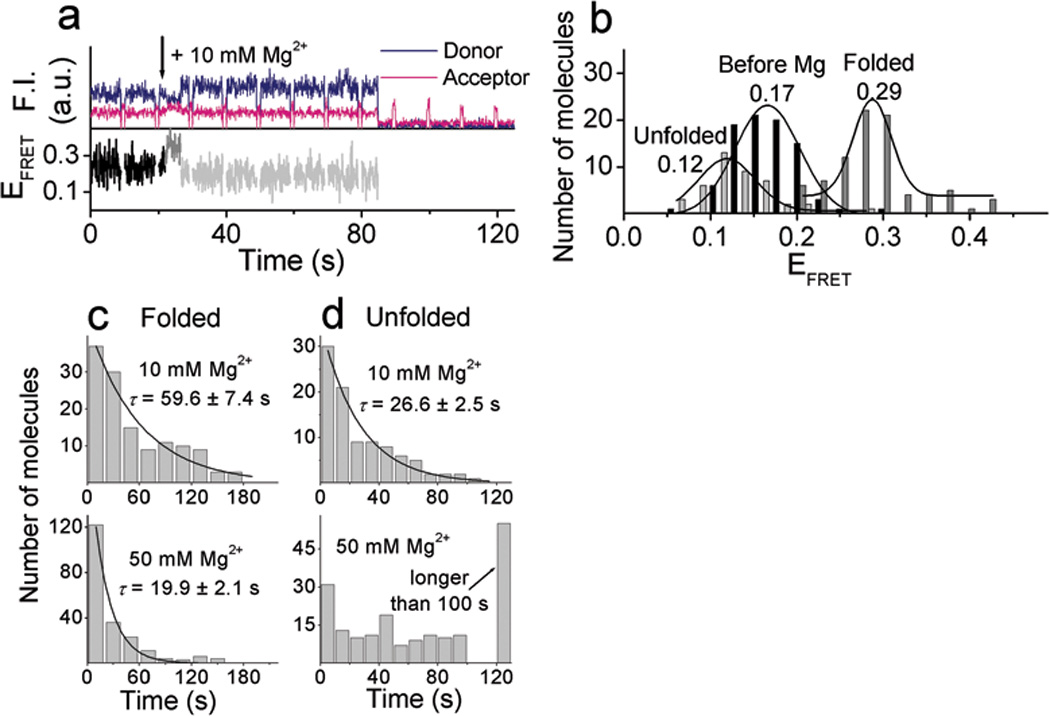
Mg2+–dependent conformational changes and cleavage reaction. (a) Time traces of donor and acceptor fluorescence signals and FRET changes along the 10 mM Mg2+–dependent reaction with the cleavable substrate. (b) Histograms of FRET at the three different levels obtained from the individual FRET time traces in the presence of 10 mM Mg2+. Dwell time histograms of (c) folded state (EFRET ~ 0.29) and (d) unfolded state (EFRET ~ 0.12) in the presence of 10 mM Mg2+ (top) and 50 mM Mg2+ (bottom). Histograms were fitted to a single exponential decay curve. Data for 10 mM and 50 mM Mg2+ were obtained from three and two sets of experiments, respectively.