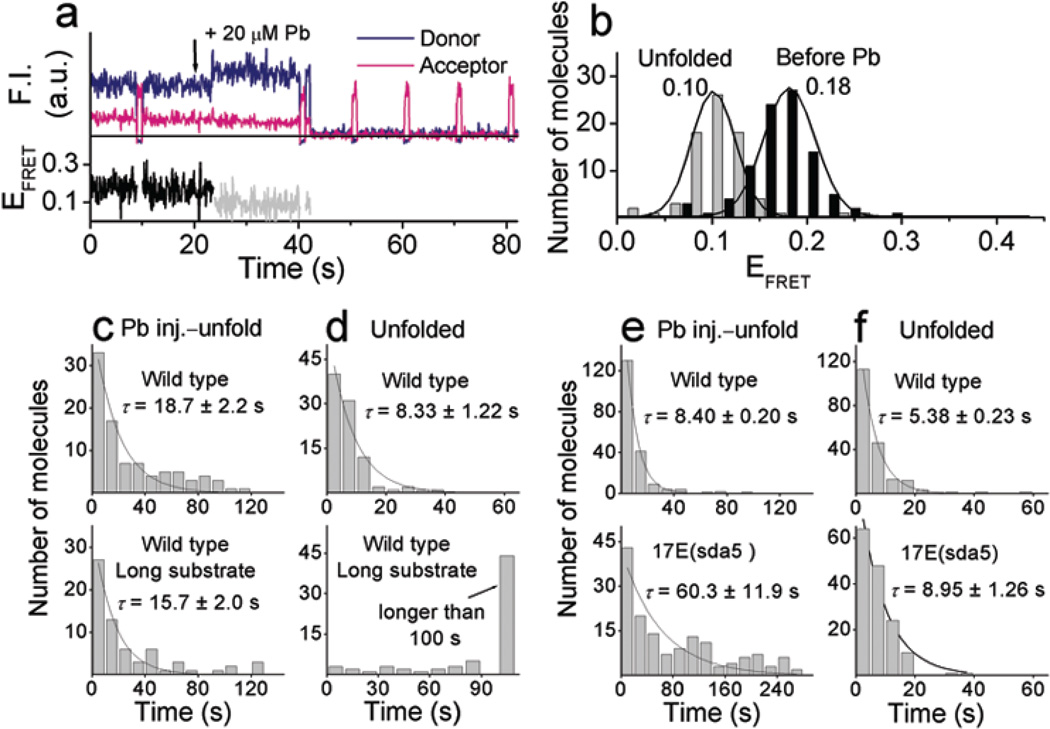
Figure 4.
Pb2+–dependent conformational changes and cleavage reaction. (a) Time traces of the fluorescence signals and FRET changes upon injection of 20 µM Pb2+ at 21 s with the cleavable substrate. (b) FRET histograms obtained by measuring the FRET values at the two different states. (c) and (d). Comparison between the cleavable substrate (top) and the long cleavable substrate (bottom) with the wild type enzyme. Dwell time histograms of (c) the Pb2+ injection to FRET change to EFRET ~ 0.10 state and (d) of the unfolded state (EFRET ~ 0.10). The glucose oxidase concentration was 33 U ml−1. Data were obtained from one each set of experiment. (e) and (f) Comparison between the wild type (top) and 17E(sda5) mutant (bottom). Dwell time histograms of (e) the Pb2+ injection to FRET change to EFRET ~ 0.10 state and (f) of the unfolded state (EFRET ~ 0.10). The glucose oxidase concentration was 16 U ml−1. Data for the wild type and the 17E(sda5) were obtained from two and one sets of experiments, respectively. Average reaction times, τ, were measured by fitting the histograms to a single exponential curve.

