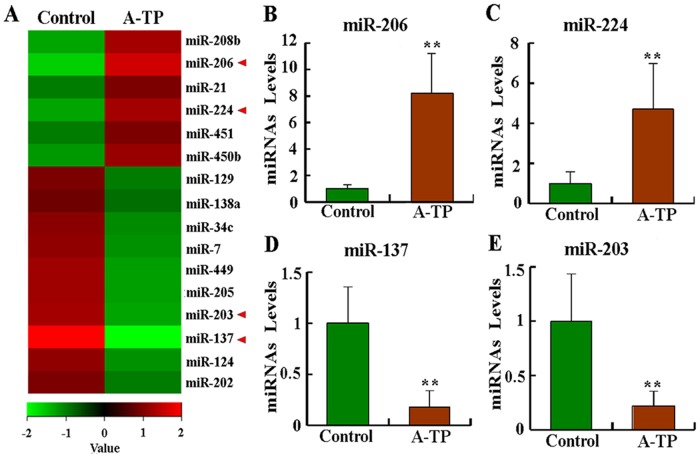
Fig 1. MiRNA expression profiling in the left superior FP (LSFP) subjected to atrial tachypacing (A-TP) in dogs.
MiRNAs found to be significantly upregulated or downregulated in all tissues following A-TP compared with control samples were selected. (A) Heat map of miRNA profiles showing an increase or decrease in miRNA expression in the A-TP group. The coloring is standard; a red to green gradation in color represents higher to lower expression levels. The levels of miRNAs marked with red arrows were verified using quantitative assays. Detailed results of the levels of miRNAs in each layer of the hierarchical map are presented in Table 2. (B)- (E) Expression levels of selected miRNAs identified by expression profiling were independently determined using qRT-PCR. qRT-PCR data were normalized to U6. ** P < 0.01 compared with control samples.

