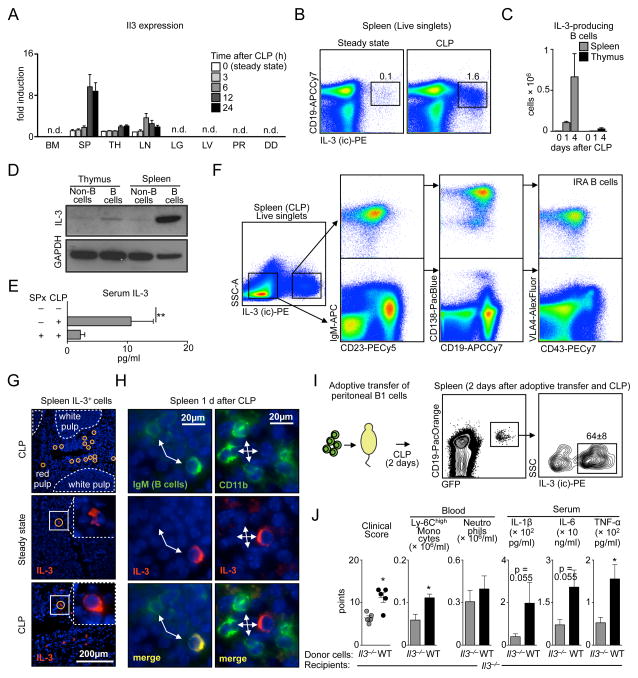
Figure 3. IRA B cells are major sources of IL-3 in sepsis.
(A) Il3 mRNA expression in the indicated organs during steady state and 3, 6, 12, and 24 h after CLP (n = 6–8). (B) Identification of IL-3 producing cells in the spleen 4 d after CLP. (C) Enumeration of IL-3-producing B cells in spleen and thymus in steady state and 1 and 4 days after CLP (n = 5). (D) Western blot showing IL-3 expression by B cells and non-B cells sorted from the spleen and thymus 1d after CLP. (E) IL-3 serum levels in steady state and 1 day after CLP with and without splenectomy (SPx) (n = 3–6). (F) Flow cytometric plots show the phenotype of IL-3+ and IL-3− cells retrieved from the spleen after CLP. A representative plot of n = 5 is shown. (G) Immunofluorescence microscopy of spleen tissue in the steady state and 1 day after CLP. (H) Co-staining of representative IL-3+ cells with IgM. (I) Adoptive transfer of 1.5 × 10⁶ peritoneal B1 B cells from GFP+ mice into WT mice subjected to CLP at the time of cell transfer. Representative plots from flow cytometric analysis of n = 3 mice are shown. (J) Adoptive transfer of 3 × 10⁶ peritoneal B1 B cells from WT or Il3−/− mice to the peritoneum of Il3−/− recipients subjected to CLP. Data show the clinical score, number of Ly-6Chigh monocytes, neutrophils, and serum cytokines 1 d after CLP (n = 5). (*P<0.05, **P<0.01). Error bars indicate means ± SEM. Significance was assessed by Kruskal-Wallis test with Dunn’s multiple comparison test (E); and Mann-Whitney test (J).

