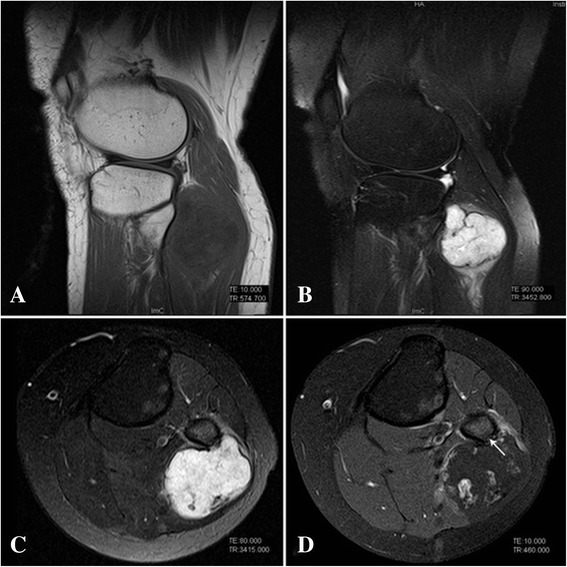
Figure 2.

MRI of tumor. A Sagittal T1-weight image shows a homogeneous hypo-intensity mass on the posterolateral aspect of the left proximal fibula. B, C Sagittal and axial T2-weight images show a hyper-intensity mass (5.5 × 5.0 × 4.5 cm) with a multilobular configuration. D Axial T1-weighted MRI with fat suppression shows the contrast enhancement around the tumor and cortical invasion (arrow).
