
Figure 2.
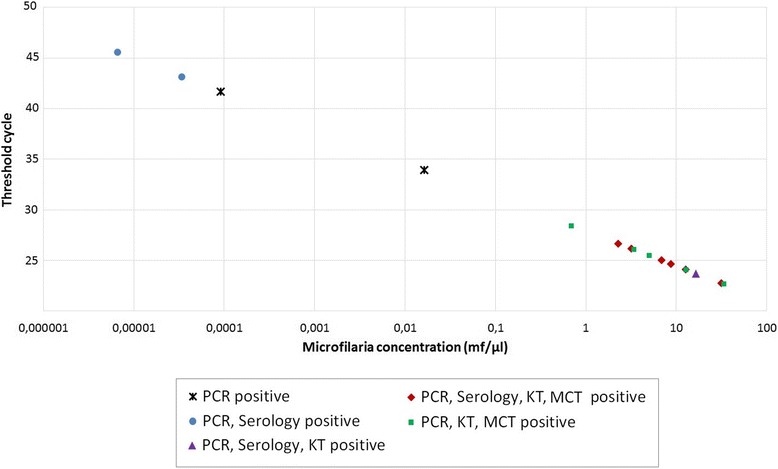
Comparison of the HRM real-time qPCR, microscopic and serological methods in D. immitis- detection. Each point of the curve corresponds to a sample positive for D. immitis according to the HRM real-time qPCR and/or the microcapillary test (MCT), Knott’s test (KT) and a serological assay. The concentration of mf/μl was obtained by interpolation to the standard curve. The MCT and KT detected only samples with concentrations higher than 0.7 mf/μl as shown in the high microfilaremic section of the graph.