Figure 3.

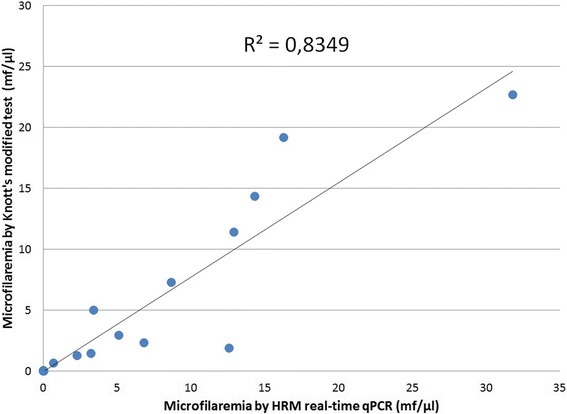
Correlation between microfilarial concentrations obtained by HRM real-time qPCR for D. immitis and the Knott’s test. The coefficient of linear regression is shown in the graph. Each point corresponds to a different dog blood sample.

Correlation between microfilarial concentrations obtained by HRM real-time qPCR for D. immitis and the Knott’s test. The coefficient of linear regression is shown in the graph. Each point corresponds to a different dog blood sample.