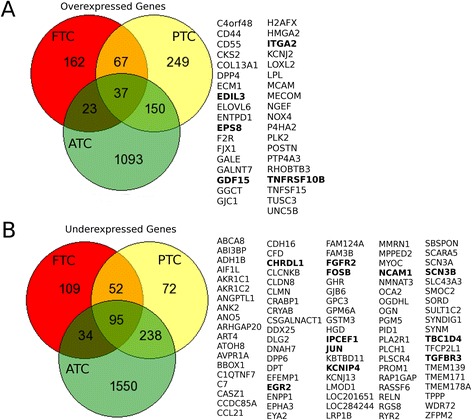
Figure 3.

Venn diagrams for the number of DEGs. Both for overexpressed (A) and underexpressed (B) genes. For both cases, the Red circle contains FTC genes, yellow circles are for PTC and the green ones present ATC genes. The columns of the right show the shared genes for the three cancer subtypes.
