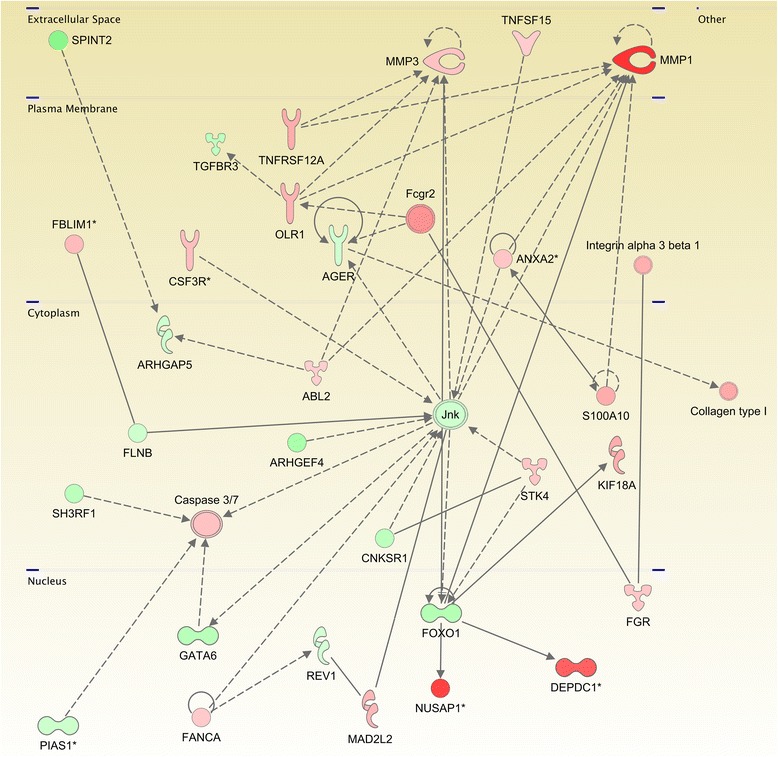
Figure 4.

Pathway for a network related to cell-death and survival process in the anaplastic thyroid carcinoma. This graph shows the interaction network of the differentialy expressed genes of ATC which have a role in death and survival events. Red molecules are overexpressed and green molecules shows underexpression. Color intensity represents the difference between the ATC samples compared with the normal ones. Notice the high degree of conection of MMP1 and Jnk molecules. It is also worth to mention that most molecules in the plasma membrane are overexpressed meanwhile those in nucleus and cytoplasm have low expression values.
