
Figure 2.
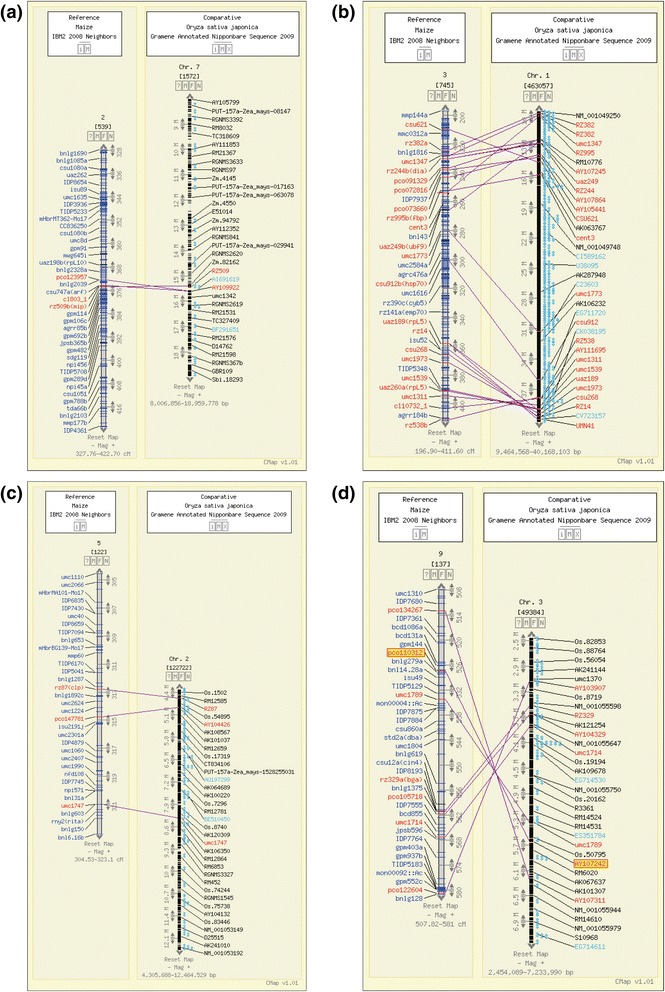
Comparative maps between maize and rice. The confidence interval of mMQTL2.1 was co-linear with the physical interval of rMQTL7.1 (a); the confidence interval of mMQTL3 was co-linear with the physical intervals of rMQTL1.1 and rMQTL1.3 (b); the confidence interval of mMQTL5 was co-linear with the physical interval of rMQTL2.2 (c); the confidence interval of mMQTL9.2 was co-linear with the physical interval of rMQTL3.1 (d).