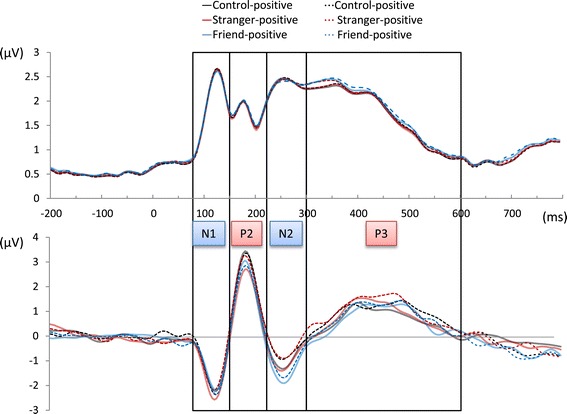
Figure 3.

GFP and grand-mean ERP waveform. The upper graph shows the GFP waveform, and under the graph are all electrodes averaged in the grand-mean ERP waveform. GFP fluctuated with the overlapping components of the grand-mean ERP. We performed GFP analysis by dividing GFP into four time windows: N1 (80 to 150 ms), P2 (150 to 220 ms), N2 (220 to 300 ms), and P3 (300 to 600 ms). GFP = global field power; ERP = event-related potential.
