
Figure 1.
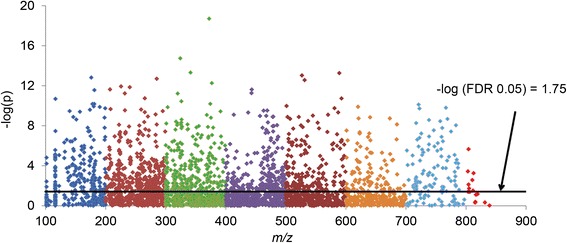
Metabolome-wide association study (MWAS). This is the snapshot of metabolites between supernatants from Plasmodium, non-infected and infected cultures at all time points using Manhattan plot on 3270 features. The features from duplicate run were averaged, log2 transformed, and quantile normalized to find out the significant features using false discovery rate (FDR). The dotted line represents FDR q=0.05. The metabolites over this line were the significant metabolites (n=1025) between two groups.