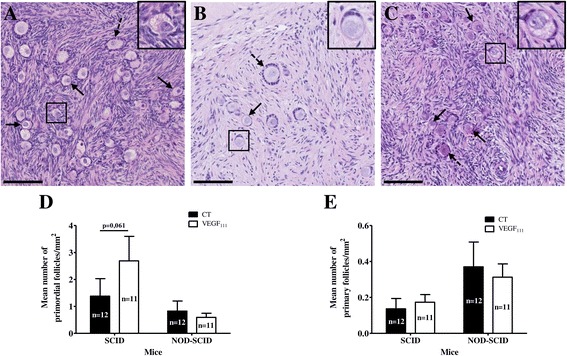
Figure 4.

Follicle analysis of ovarian tissue 3 weeks after transplantation in SCID and NOD-SCID mice. H&E sections of fresh ovarian tissue (A) and ovarian control tissue transplanted in SCID (B) and NOD-SCID (C) mice (primordial and primary follicles are identified by plain and dotted arrows, respectively). Quantification of primordial (D) and primary (E) follicle density in ovarian transplants with or without VEGF111 treatment and grafted in SCID or NOD-SCID mice. Scale bar: 100 μM. Images are representative of at least 2 experiments.
