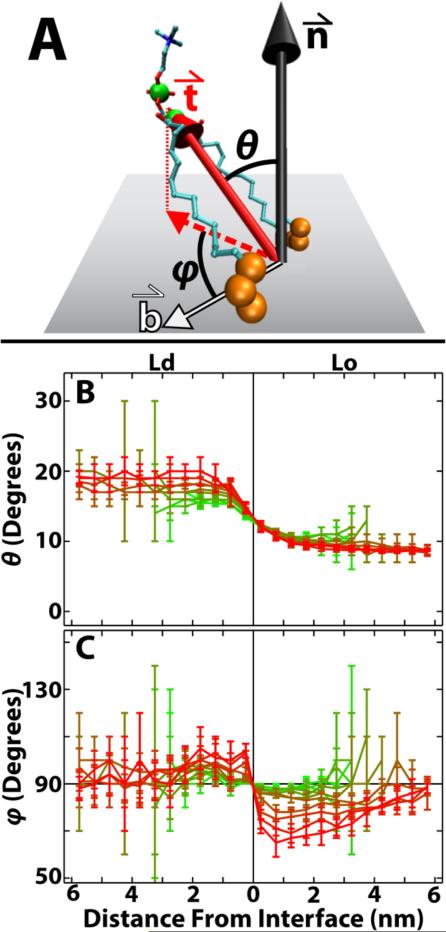
Figure 8.
Lipid tilt is affected by phase and distance to interface. (A) Lipid tilt vector () connects the combined center of mass of the last three carbons on each acyl chain (large orange spheres) to the combined center of mass of the CD atom and phosphorus of the headgroup (large green spheres). The local bilayer midplane, which is assumed to lie along the xy plane, is shown as a gray rectangle. is the bilayer normal, and is the vector joining the lipid center of mass to the nearest phase interface. θ and φ are, respectively, the polar and azimuthal angles of : θ is the angle between and , and φ is the angle between (projected onto the xy plane) and . (B) θ is larger, i.e. lipids tilt more, in the Ld phase compared to the Lo phase. (C) Near the interface, lipids tilt away from the interface in Ld (φ > 90°) but towards the interface in Lo (φ < 90°). Results shown from ρ = 0 (green) to ρ = 1 (red). Molecule representation visualized in VMD version 1.9.

