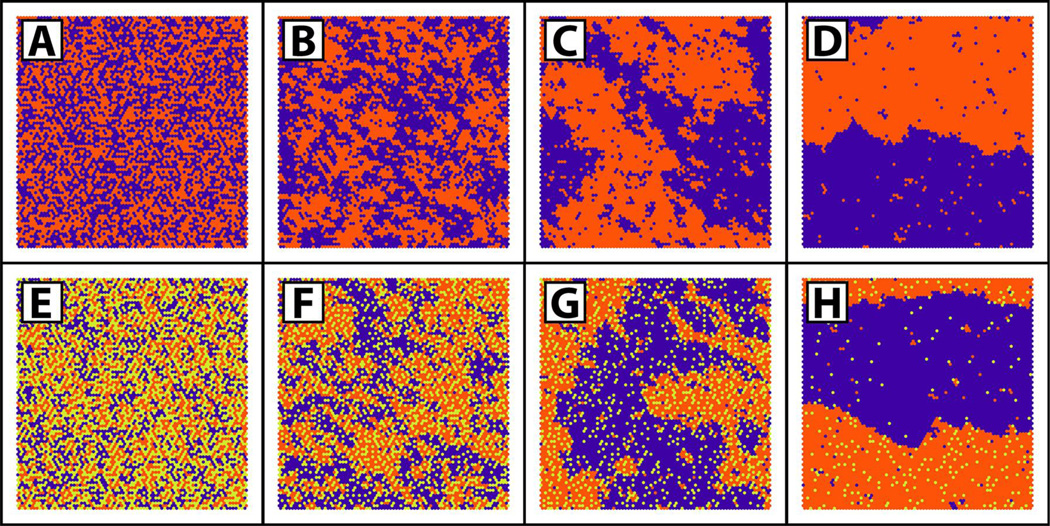
Figure 2.
Monte Carlo simulations provide pictures of molecule distributions in mixtures of three components representing e.g. a low-Tm lipid (purple), a high-TM lipid (orange) and cholesterol (yellow-green) [15]. Two-component (A–D) mixtures containing equal amounts of the low-Tm lipid and cholesterol show random mixing at ΔEm = 0 kT (A), non-ideal mixing at ΔEm = +0.4 kT (B), large-scale clusters at ΔEm = +0.55 kT (C), and phase separation at ΔEm = 0.7 kT (D). Three-component mixtures (E–H) containing equal amounts of the low-Tm and high-Tm lipids show increasing levels of clustering and eventual phase separation as cholesterol content is decreased from 45% (E), to 30% (F), to 20% (G), to 5% (H). For (E–H), the ΔEm for interactions between low-Tm – high-Tm, low-Tm – chol, and high-Tm – chol are respectively +0.8 kT, −0.8 kT, and −1.2 kT.

