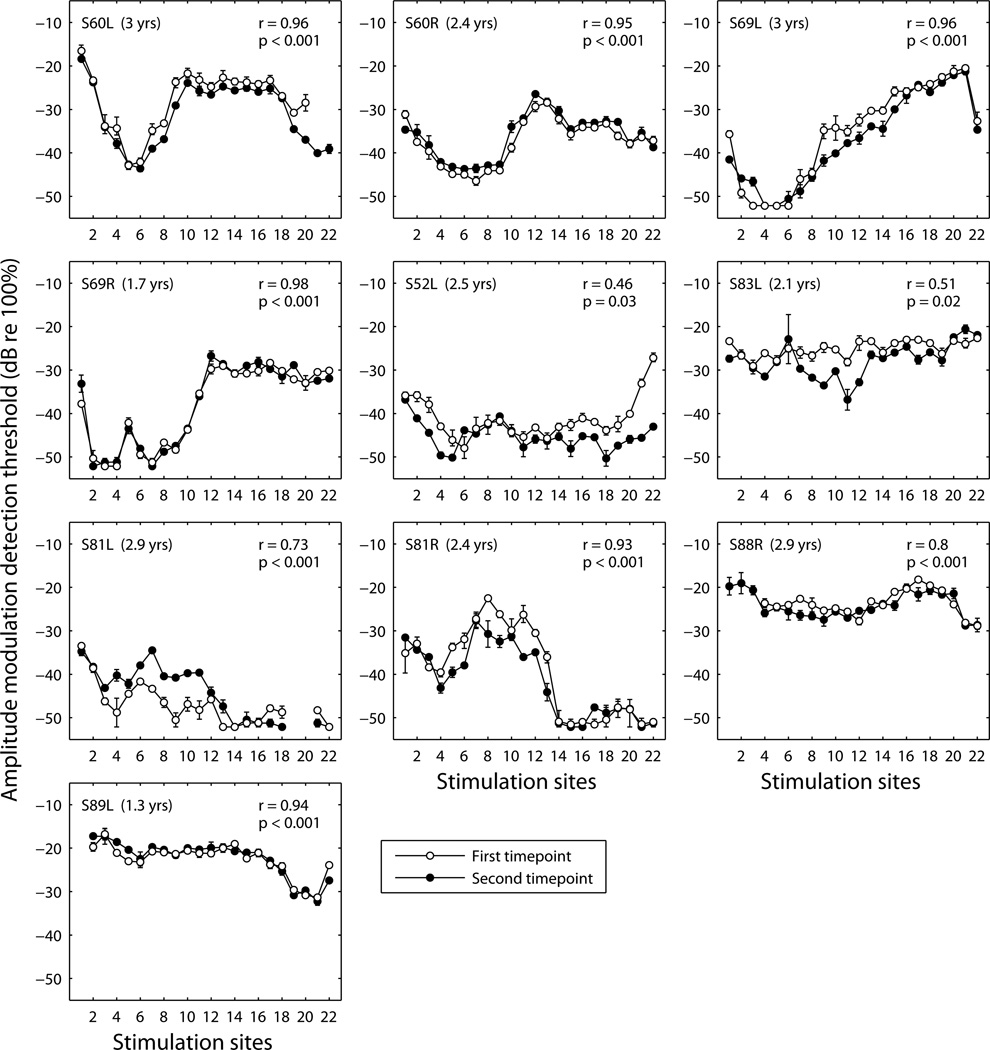
Figure 2.
Stability of modulation detection thresholds over time. Data for 10 ears are shown with the subject and ear designation given in the upper left corner of each panel. Modulation detection thresholds were measured at all available stimulation sites at two timepoints with the time elapsed between the two timepoints (in years) shown in each panel. The first and second sets of data are shown in different symbols: open symbols for the first timepoint and filled symbols for the second timepoint. Each data point represents the mean of two measurements at a given timepoint with error bars representing the range of the data. Statistics for correlation across the electrode array between the data at the first and second timepoints are shown in the upper–right corner of each panel. For these correlations the means of the two measurements at each site at the first timepoint were correlated with the means of the two measurements at each site at the second timepoint.

