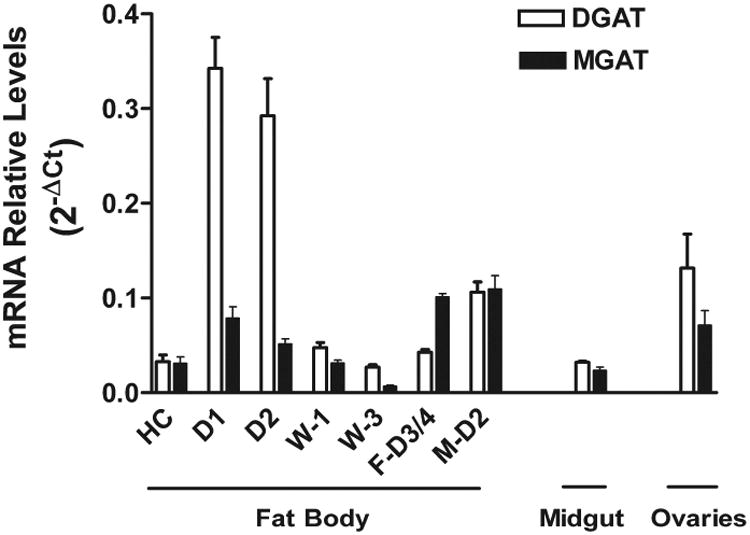
Figure 7. Expression of MGAT and DGAT1 mRNA.

The relative levels of mRNA were determined by qPCR using as reference the ribosomal protein S3 mRNA. The levels of MGAT mRNA represent the sum of both isoforms cloned in this study. HC: headcap (4th-5th instar); D1 and D2: 5th instar feeding larva day 1 and day 2; W1 and W3: pre-pupa wandering day 1 and day 3; F-D3/4: Adult Female 3-4 days old; M-D2: Adult male day 2.
Data shown represent the mean of three biological replicates and each biological sample was analyzed in triplicates. The error bars represent the combined instrumental and biological standard deviations. Error bars= 2-(ΔCt +/- SD).
