
FIGURE 2.
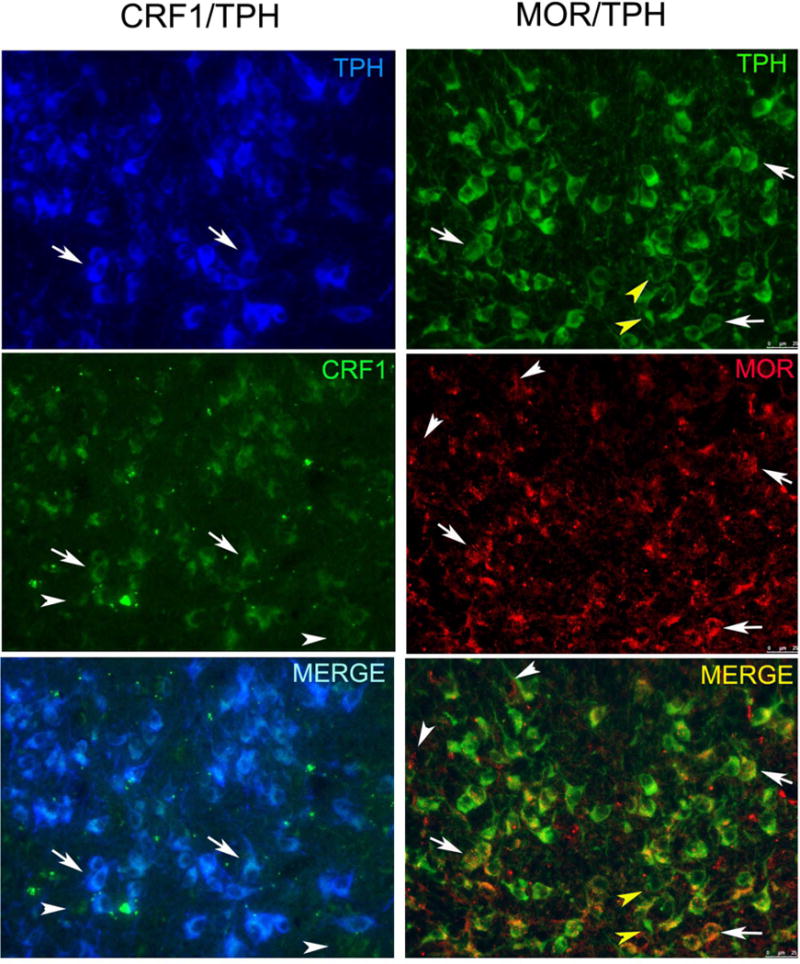
Fluorescent photomicrographs of sections through the DN that were dual labeled to visualize either CRF1 and tryptophan hydroxylase (CRF1/TPH) or MOR and tryptophan hydroxylase (MOR/TPH). The leftmost panel shows TPH cells in blue and CRF1 in green. Dual labeled cells in the merged panel appear whitish blue. Arrows point to examples of dual labeled cells. Arrowheads point to single labeled CRF1 neurons. The rightmost panel shows TPH cells in green and MOR in red. Dual labeled cells in the merged panel appear yellow/orange. Arrows point to examples of dual labeled cells. White arrowheads point to single labeled MOR neurons and yellow arrowheads point to single labeled TPH neurons.