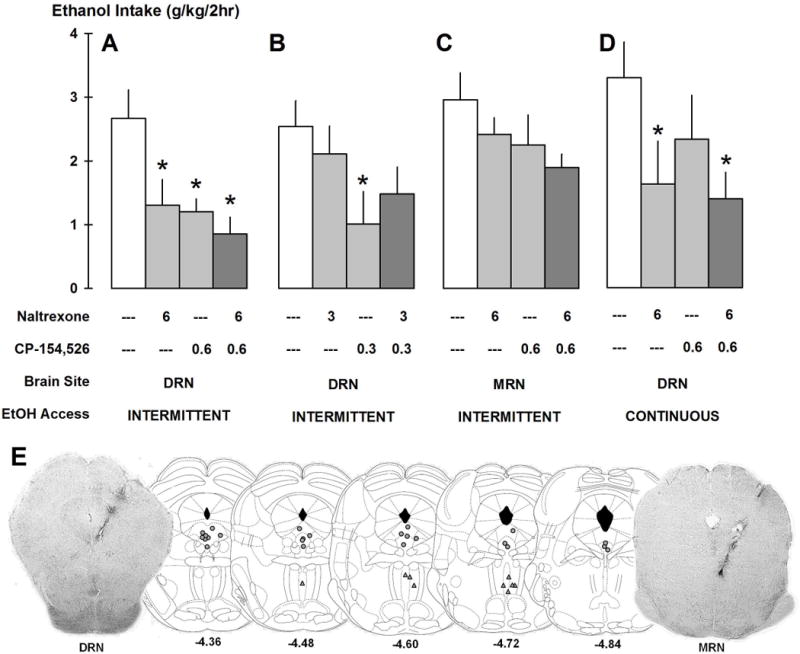
FIGURE 3.

Separate groups of mice were microinjected with aCSF, naltrexone, CP154526 and the combination of naltrexone and CP154526 to reduce ethanol drinking. Panel A shows intra-DRN microinjections of higher doses in intermittent access drinkers (n=8). Panel B shows intra-DRN microinjections of lower doses in intermittent drinkers (n=7). Panel C shows intra-MRN microinjections in intermittent drinkers (n=9). Panel D shows intra-DRN microinjections in continuous access drinkers (n=9). Bars represent mean ethanol intake (g/kg/2h) ± SEM. *p<0.05 vs. aCSF. Panel E shows representative schematics of correct placements of microinjection cannulae in the DRN (grey circles, n=24) or MRN (grey triangles, n=9). Numbers below coronal slices are the distances (mm) from bregma. Photos show correct placement in the brain areas.
