
Figure 2.
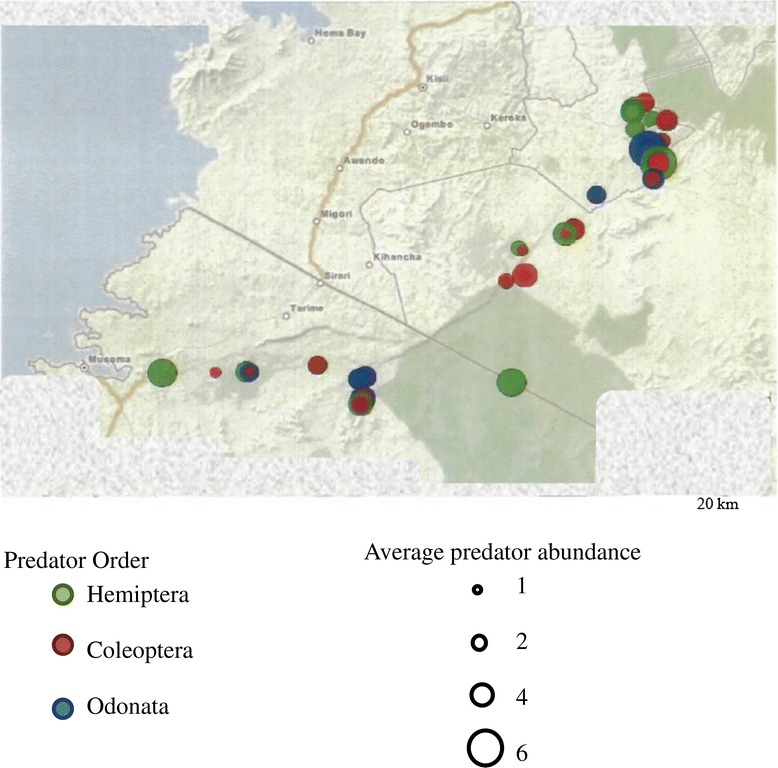
Dot size and color show predator order and average number at sampling sites along the Mara river and tributaries, Kenya and Tanzania (n = 39).
Official websites use .gov
A
.gov website belongs to an official
government organization in the United States.
Secure .gov websites use HTTPS
A lock (
) or https:// means you've safely
connected to the .gov website. Share sensitive
information only on official, secure websites.
Dot size and color show predator order and average number at sampling sites along the Mara river and tributaries, Kenya and Tanzania (n = 39).