
Figure 3.
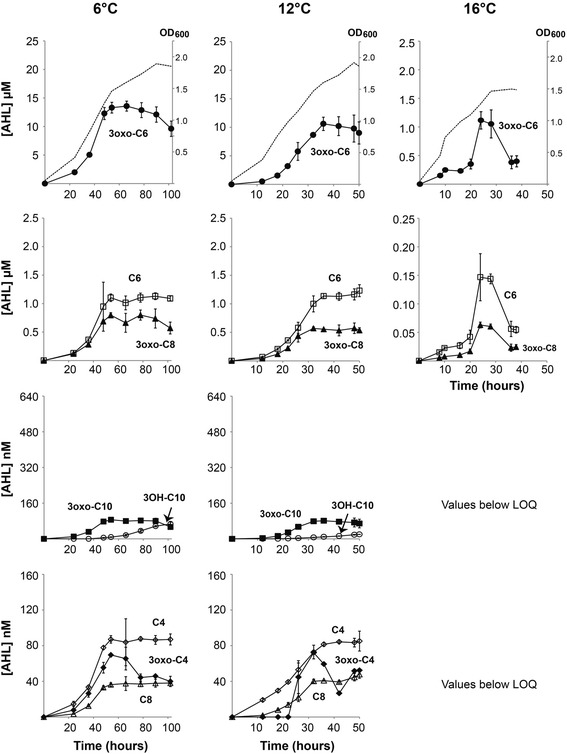
AHLs produced by the A. salmonicida ΔlitR mutant at different temperatures and cell densities. Supernatants were harvested at different time points during growth at 6, 12 and 16°C. The AHL concentrations were measured by HPLC-MS/MS and are shown with respect to time (hours) and cell density (OD600). Symbols indicate the different AHLs; 3-oxo-C6-HSL (●), C6-HSL (□), 3-oxo-C8-HSL (▲), 3-OH-C10-HSL (○), 3-oxo-C10-HSL (■), C4-HSL (◇), 3-oxo-C4-HSL (◆) and C8-HSL (∆). Each value represents the mean of triplicates from three biological replicates. The error bars represent the standard deviations. The dotted lines in the top panels display the growth curves of the ΔlitR mutant at the different temperatures.