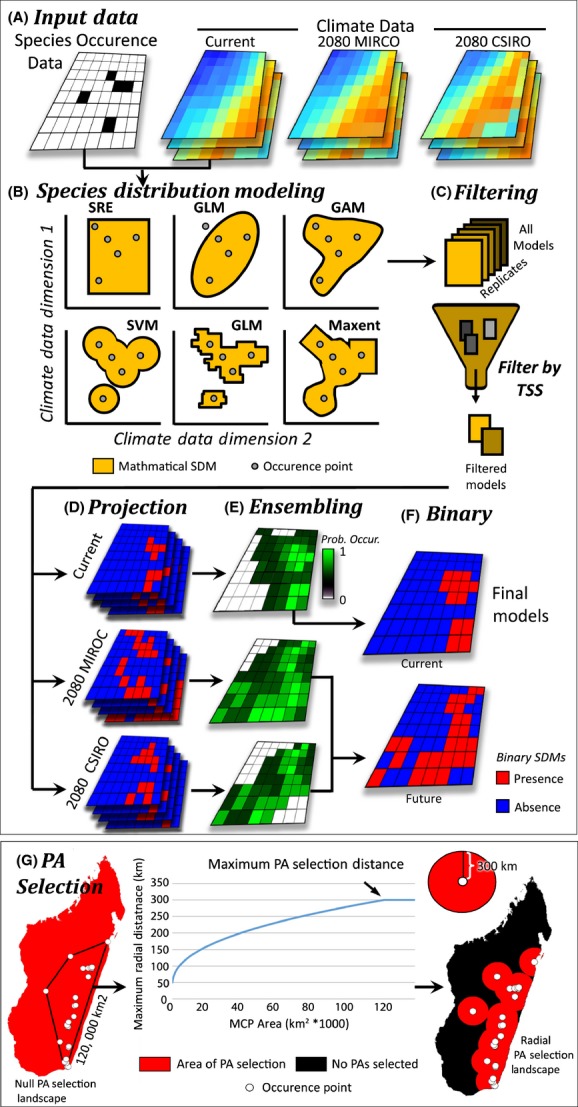
Figure 1.

Overview of species distribution modeling here employed. (A) Species occurrence data and climate data were prepared for Madagascar, (B) SDMs were built based on ten widely used modeling techniques (only six are pictured). (C) The resulting models, including replicates of each method, are filtered based on their abilities to predict known occurrences and pseudo-absences using a true skill statistic (TSS). (D) The resulting models with TTS values ≥ 0.85 were projected throughout the climate of the current landscape and two future climate models. (E) Models for each scenario are compiled and compared, creating an ensemble probabilistic density landscape depicting the probability of a species occurrence throughout the landscape. (F) The ensemble models were then converted to a binary “presence/absence” landscape from which all geospatial analyses were performed on. (G) To create high-quality species distribution models, we carefully selected pseudo-absences (PAs). Here, we select PAs within a variable distance from each known occurrence point determined by calculating the area of a minimum convex polygon from occurrence points and transforming that to reflect a logistic curve with values from 50 to 300 km. This method is sensitive to changes in smaller ranges, making it suitable for use on micro-endemic to broadly distributed species.
