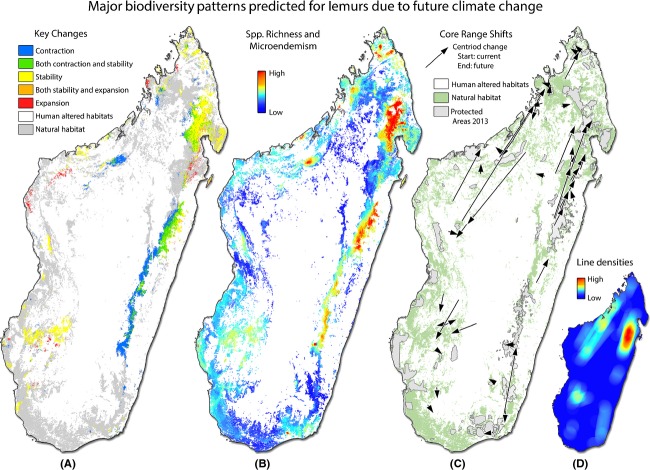
Figure 2.
Major distribution patterns predicted for lemurs resulting from future climate change. (A) Depicts areas where three or more species will experience contraction, expansion, or stability. Cool colors correspond to areas of contraction and warmer colors depict areas of stability and expansion. (B) Depicts areas of high species richness and/or high levels of micro-endemism for both current and future (2080) scenarios. Warm colors depict areas with high biodiversity values at both time periods and should thus have the greatest conservation potential. (C) Map of core range shifts depicts the predicted distribution changes (based on the centers of their distributions) of each focal species. Each line depicts predicted distributional shifts of the species range centroid from current (start of arrow) to 2080 (end of arrow) scenarios. (D) Areas of highest conservation concern. The line densities depicted by warmer colors illustrate areas of high overlap in core range shifts through time. In these areas, it will be vital that protected areas are connected to facilitate dispersal into appropriate habitats.

