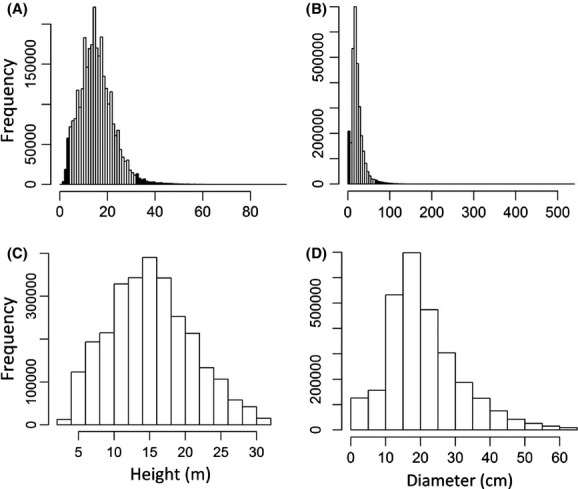
Frequency distributions of tree height (m) and diameter (cm) in the FIA dataset before subsetting (A and B) and after (C and D). Black shaded bars represent the data removed in subsequent analyses, representing 6.92% of the total dataset.

Frequency distributions of tree height (m) and diameter (cm) in the FIA dataset before subsetting (A and B) and after (C and D). Black shaded bars represent the data removed in subsequent analyses, representing 6.92% of the total dataset.