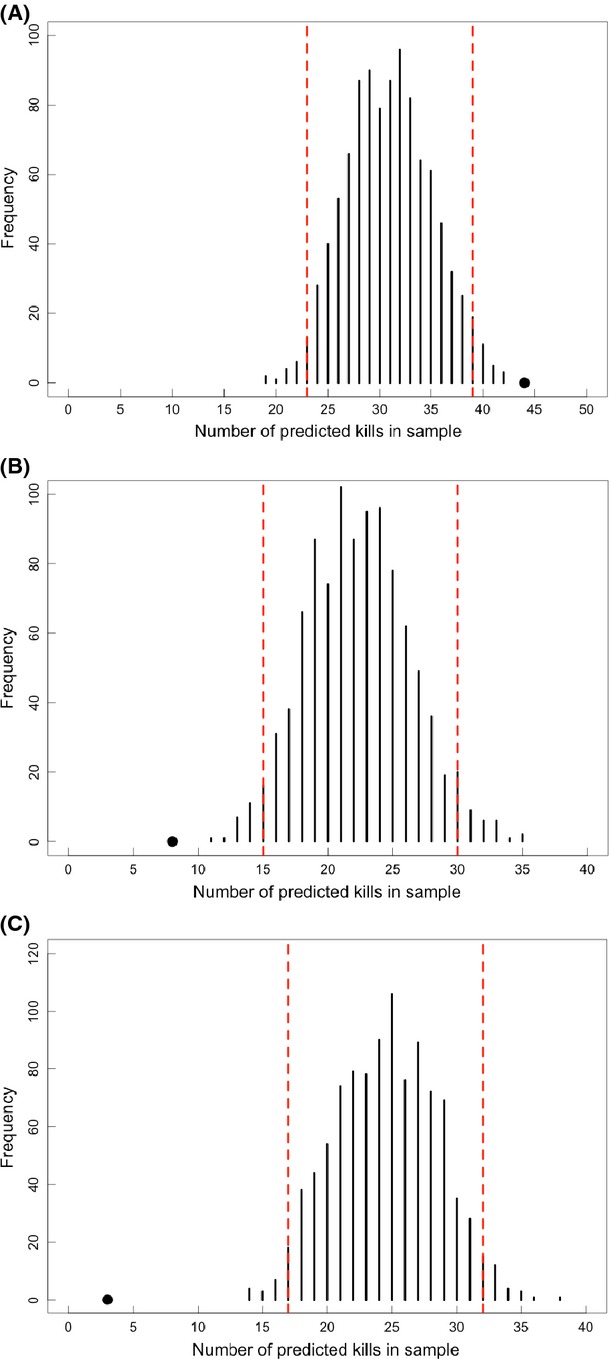
Figure 4.

Model validation results for randomization tests using an independent dataset of known tiger kills (n = 70) for models at (A) 20-m, (B) 100-m, and (C) 200-m spatial grains. The random distribution (black bars) was calculated by sampling 1000 batches of 70 randomly selected sites from binary predation risk maps designated as “kill” or “no kill” (see Methods for details). Each black bar represents the frequency of random samples (out of 1000) with the given number of random sites designated by the model as “kills”. Dashed red lines bound 95% of the random distribution. Solid points represent the validation dataset and show the number of known tiger kills that were accurately classified by the model as “kills”. Solid points located beyond 95% of the random distribution indicate that predictive performance is significantly better than random.
