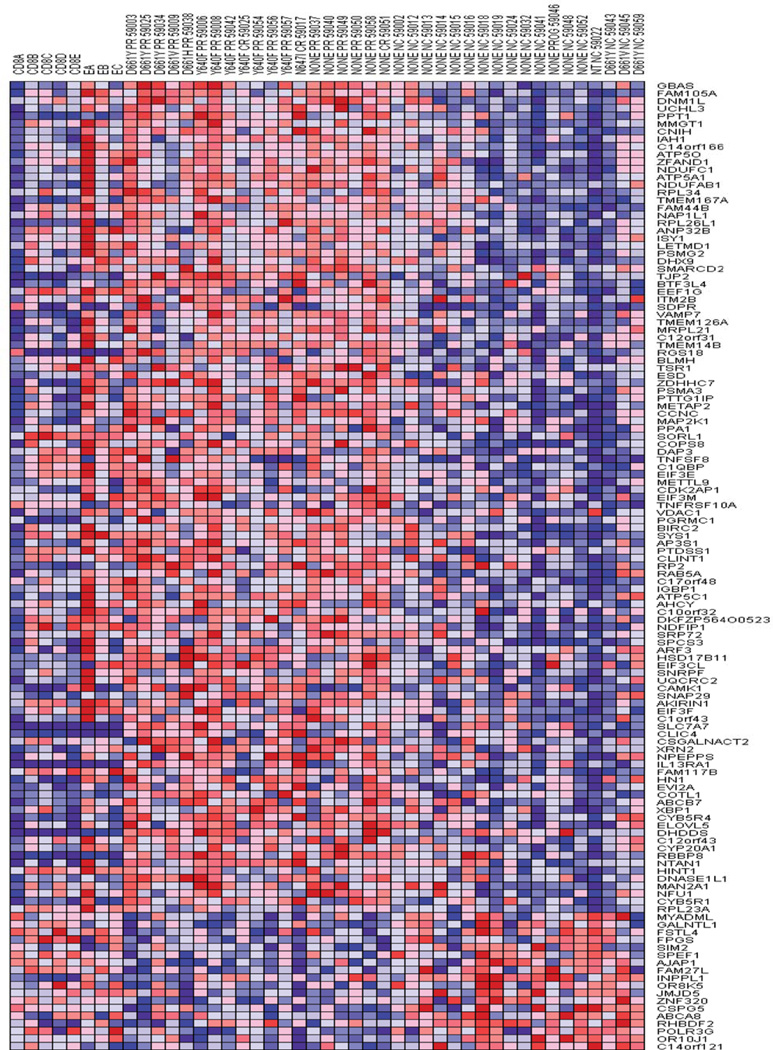
Figure 2. Heatmap of baseline sample gene expression in Methotrexate responders versus nonresponders.
The top 126 genes by Z-score are displayed. Red shading indicates upregulation of mRNAs which are listed by official gene symbol at right. Samples are divided into 4 main groups from left to right, normal CD8+, normal Temra, patients with response to Methotrexate and lastly those not responding. Individual patient lanes are labeled by mutation type, type of response and trial accession number.
PR = partial response, CR = complete response, NC = no change, and PROG = progression

