
FIGURE 2.
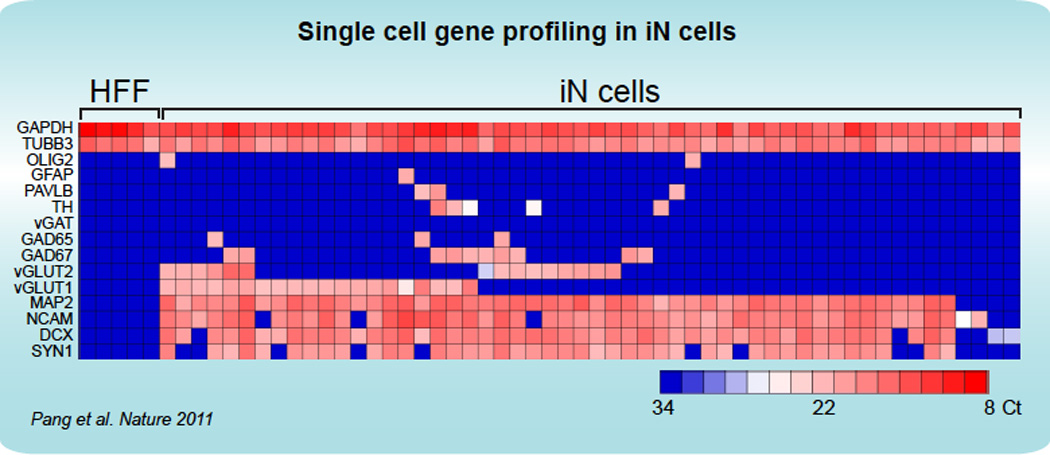
Single-cell gene expression profiling using Fluidigm dynamic arrays. Rows represent the evaluated genes and columns represent individual cells. Heat map (blue to red) represents the threshold Ct values as indicated. HFF = Human Fetal Fibroblast; iN = inducible Neuron. (from Pang et al., Nature 2011)