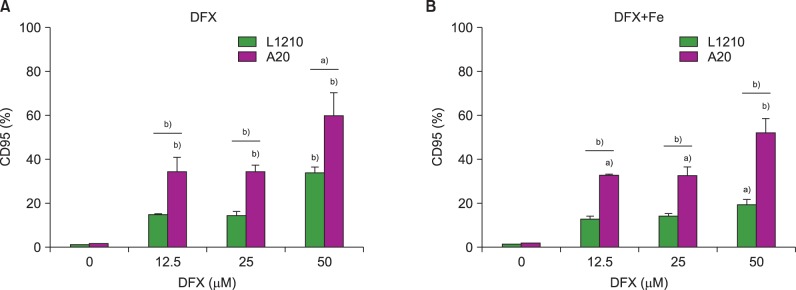
Fig. 3. Measurement of CD95 (Fas) expression in L1210 and A20 cells after 24 h DFX treatment with or without FeCl3, according to DFX concentration (12.5-50 µM). Experiments were performed in triplicate. All data are presented as the mean±standard error (a)P<0.05, b)P<0.01).

