Figure 1.
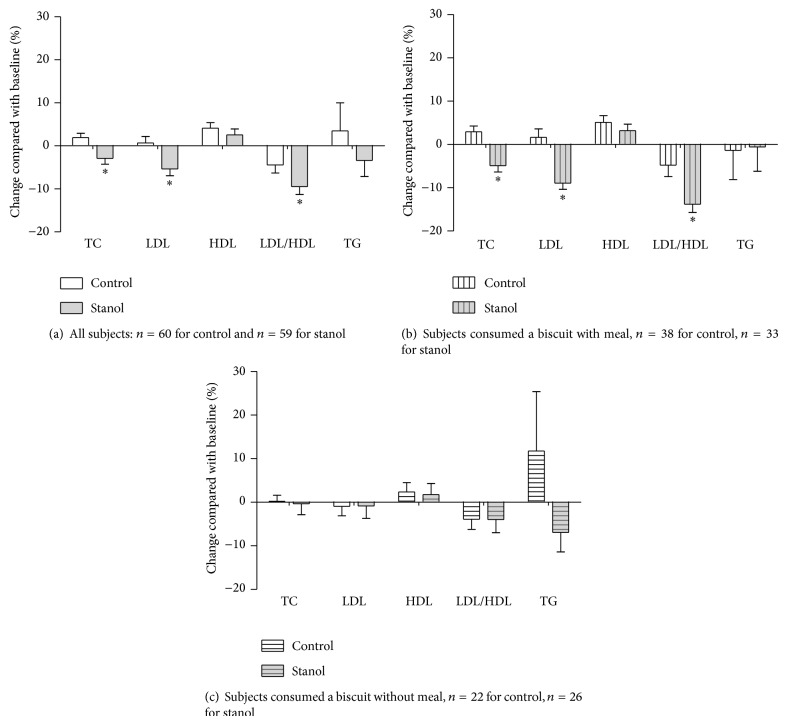
The percentage change in total, LDL, HDL, and LDL/HDL ratio and triglyceride concentrations from baseline comparing between control and stanol groups (mean ± SEM), (a) total subjects; (b) subgroup: subjects consumed a biscuit with meal; (c) subgroup: subjects consumed a biscuit alone (without meal). * P < 0.01 significantly different from control group.

