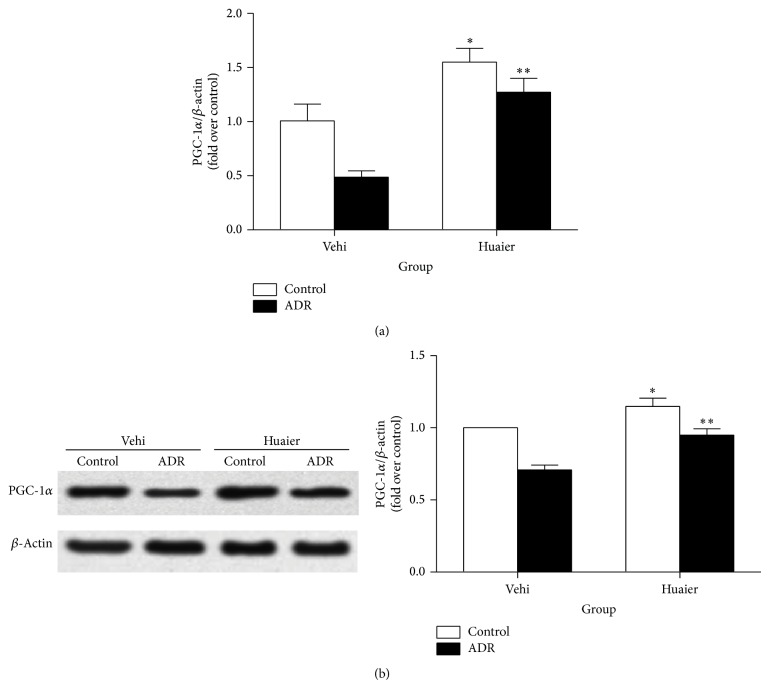
Figure 6.
Huaier induced PGC-1α expression in vitro. (a) Real-time RT-PCR of PGC-1α. (b) Western blot of PGC-1α. Left: representative immunoblots. Right: densitometric analysis. Podocytes were pretreated with Huaier (0.2 mg/mL) for 1 h followed by incubation with ADR (200 nM) for further 24 h. Data are expressed as the means ± SD (n = 6). * P < 0.05 control of Huaier group versus control of vehicle group. ** P < 0.05 versus ADR of Huaier group versus ADR of vehicle group.

