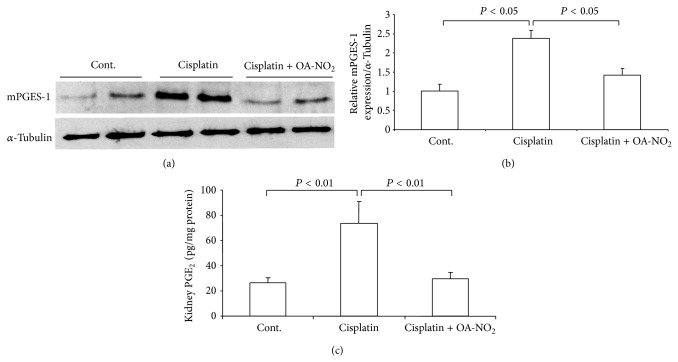
Figure 5.
Renal mPGES-1 expression and renal PGE2 content in control, cisplatin vehicle, and cisplatin + OA-NO2 mice. (a) Immunoblot analysis of mPGES-1 expression; (b) densitometric value of mPGES-1 protein; (c) enzyme-linked immunosorbent assay analysis of renal PGE2 content. Cont.: N = 6; cisplatin: N = 12; cisplatin + OA-NO2: N = 13. Data are mean ± SE.

