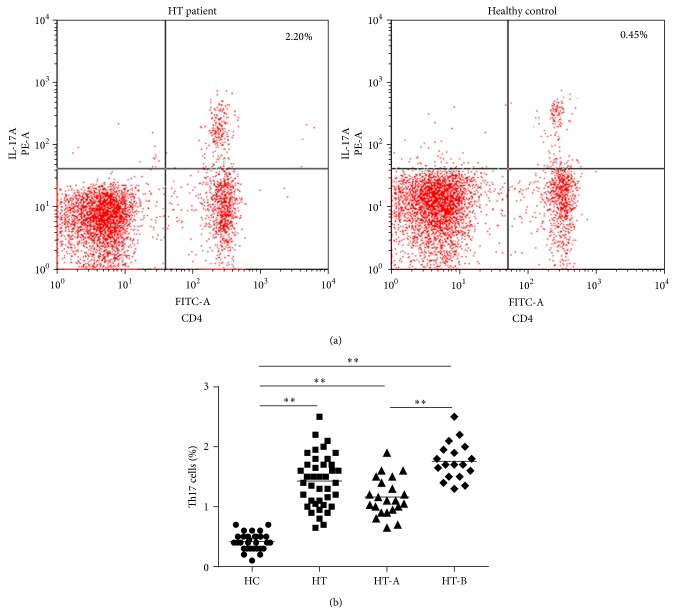
Figure 2.
(a) The representative graphs of flow cytometric analysis. CD4+IL-17A+ T cells were determined as Th17 cells. (b) Comparisons of Th17 cells percentages between subjects in HT and HC, as well as between HT subsets and HC or between HT-A and HT-B subsets. HT patients had much higher Th17 cells proportion than HC, even in euthyroidism status (** P < 0.01). Additionally, Th17 cells numbers in HT-B subgroup also increased significantly compared to HT-A (** P < 0.01), which provided the evidences of dynamic changes in different disease stages.

