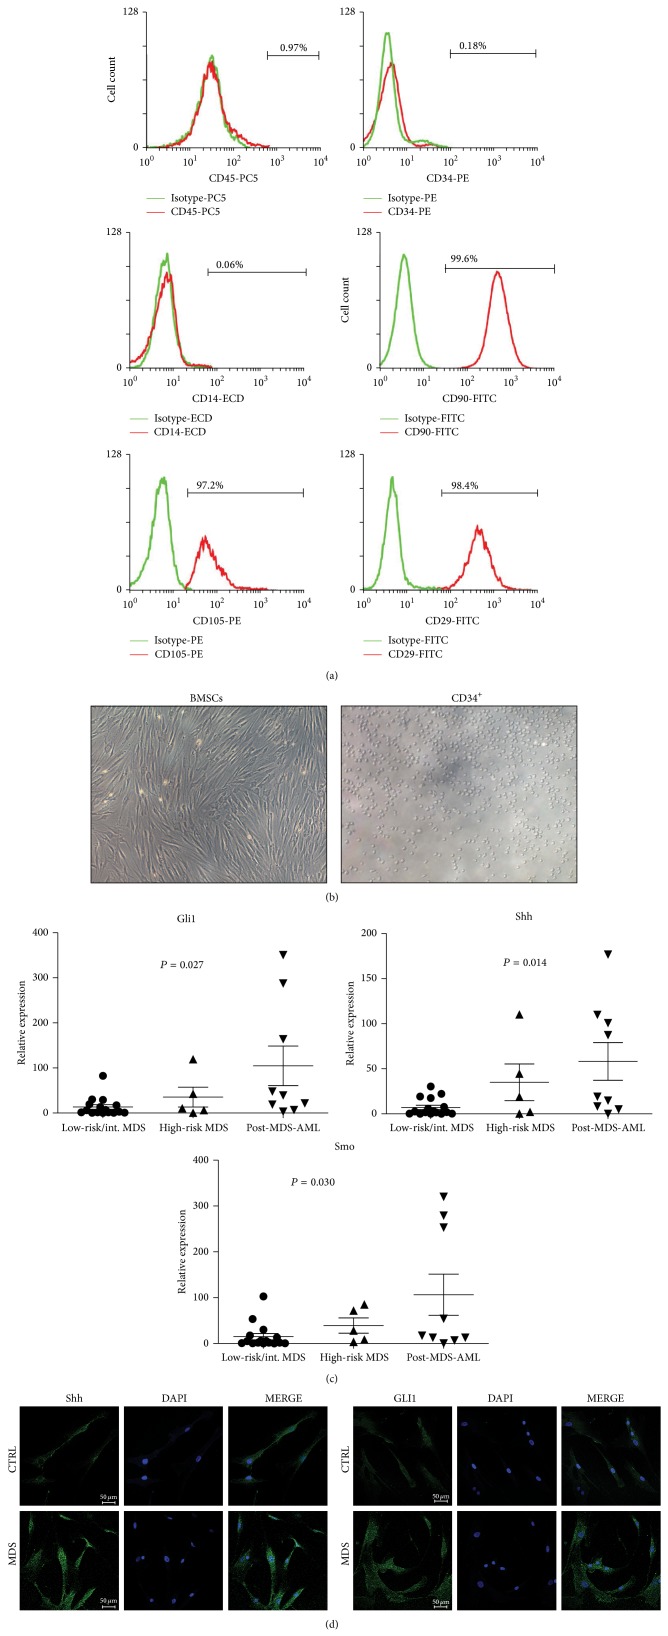
Figure 1.
Activation of Shh signaling in MDS. Mean fluorescence intensity (MFI) of CD34, CD45, CD14, CD90, CD29, and CD105 was determined in BMSCs of MDS patients and healthy donors by flow cytometric analysis. Representative histograms are shown. Green line represents the respective isotype control and red line represents MDS-derived BMSCs (a). Representative micrographs of primary BMSCs and CD34+ stem cells ((b), ×200). Real-time PCR analysis of Gli1, Shh, and Smo in primary BMSCs (n = 30) from MDS and post-MDS AML marrow samples (c). Immunofluorescence images of SHH and GLI1 protein in primary bone marrow-derived mesenchymal stromal cells from MDS patients and healthy donors (CTRL) are shown (d).

