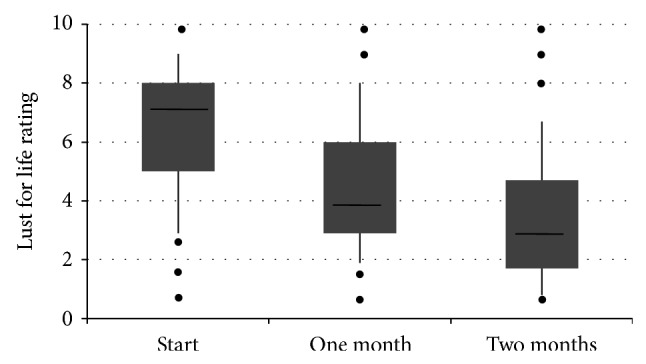
Figure 3.

A box plot of the patients' rating of the impaired “lust for life” at start of treatment and after one month and 2 months treatment. The data shows the median (horizontal bar), 1st and 3rd quartiles (top and bottom of box, resp.), and the standard deviation (vertical bar). The dots represent single outlying values.
