Figure 2.

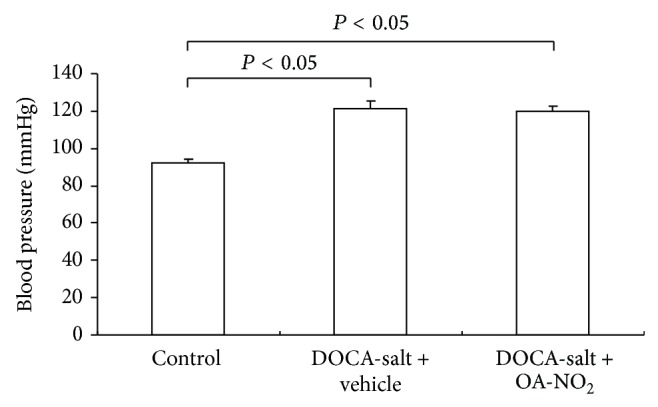
The changes of blood pressure in control (n = 5), DOCA-salt + vehicle (n = 8), and DOCA-salt + OA-NO2 (n = 8) mice after 3 weeks of DOCA-salt treatment. Data are shown as mean + SE.

The changes of blood pressure in control (n = 5), DOCA-salt + vehicle (n = 8), and DOCA-salt + OA-NO2 (n = 8) mice after 3 weeks of DOCA-salt treatment. Data are shown as mean + SE.