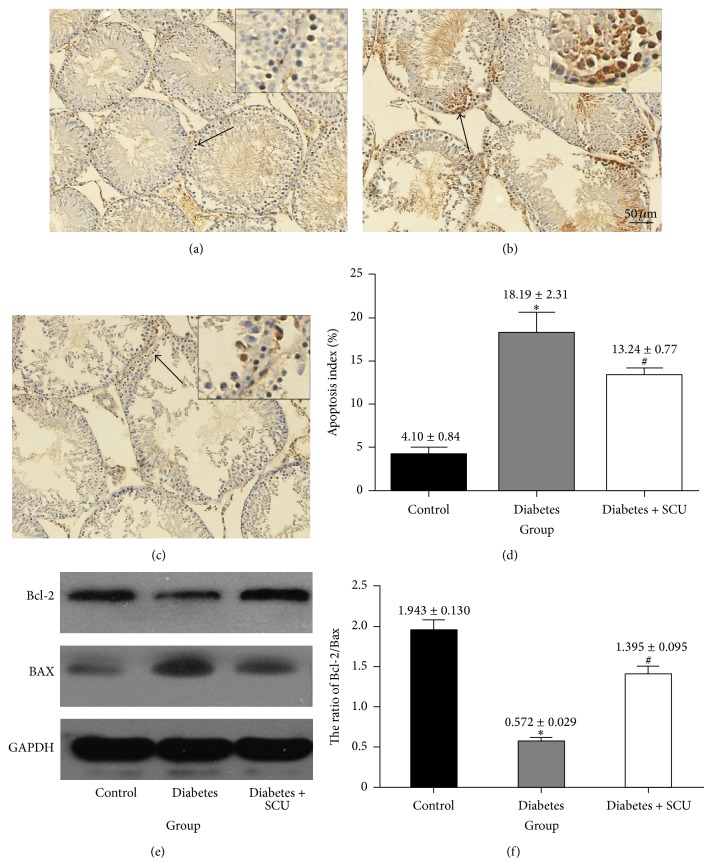
Figure 3.
Diabetes induces ROS production and lipid peroxidation with enhanced cellular apoptosis. (a)–(d) TUNEL staining of testes sections from control, diabetes, and diabetes + SCU rats. TUNEL-positive cells (indicated by arrows) in representative images are shown in (a), (b), and (c) (200x magnification and 400x magnification). Hoechst was used as cell nucleus staining. The % of apoptotic cells were quantified in (d) and calculated following the formula Apoptosis index = apoptotic cells/(apoptotic cells + normal cells) (d). Data in (d) are presented as means ± SEM, 3 fields per section and 5 sections from each testis. n = 8 rat for each group, and analyzed by t-test. *Significantly different from control group (P ≤ 0.05); #significantly different from diabetes group (P ≤ 0.05). (e) Western blot analysis was used to determine the protein expression of Bcl-2 and Bax in testicular tissue. GAPDH was used as loading control. (f) The ratio of Bcl-2/Bax was determined by quantitative evaluation of the protein expression of Bcl-2 and Bax using densitometry analyses. Samples were from three individuals in each group. Data in (f) are presented as mean ± SEM. *Significantly different from control group (P ≤ 0.05); #significantly different from diabetes group (P ≤ 0.05).

