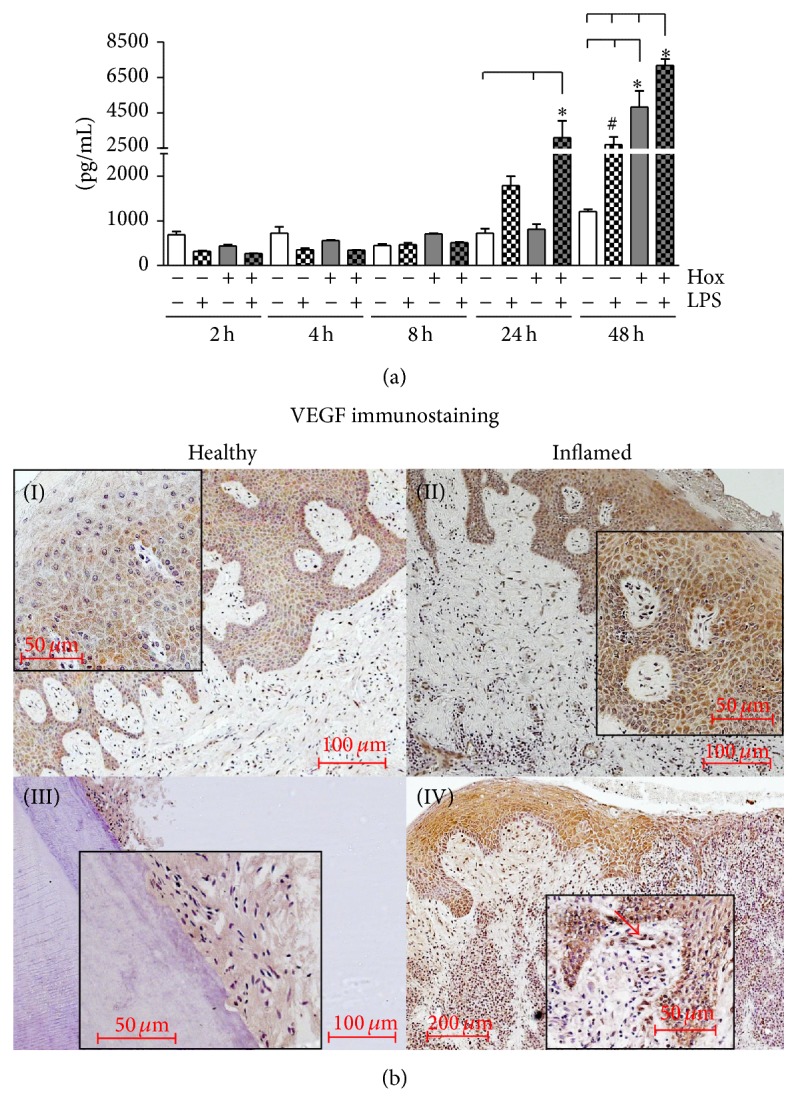
Figure 5.

VEGF protein expression. (a) VEGF protein expression in PDL cells was measured using ELISA. Supernatants of PDL cells, stimulated with or without LPS-PG (1 μg/mL) under normoxic or hypoxic condition, were collected after varying time points (2, 4, 8, 24, and 48 h). Statistical differences were analyzed by one-way ANOVA and the post hoc Dunnett's and Tukey's multiple comparison test; # P < 0.05 depicts a significant difference with respect to the time-matched control, * P < 0.05 indicates a significant difference between groups (means ± SD; n = 9). (b) Healthy gingiva (I), gingivitis (II), healthy periodontal ligament (III), and periodontitis (IV) were obtained after the approval of the Ethics Committee of the University of Bonn and parental as well as patients' written consent (n = 3). A polyclonal primary antibody against VEGF was used in a concentration of 1 : 100 for immunohistochemistry. The scale bars indicate 50, 100, or 200 μm in dependence of the magnifications.
