
Figure 1.
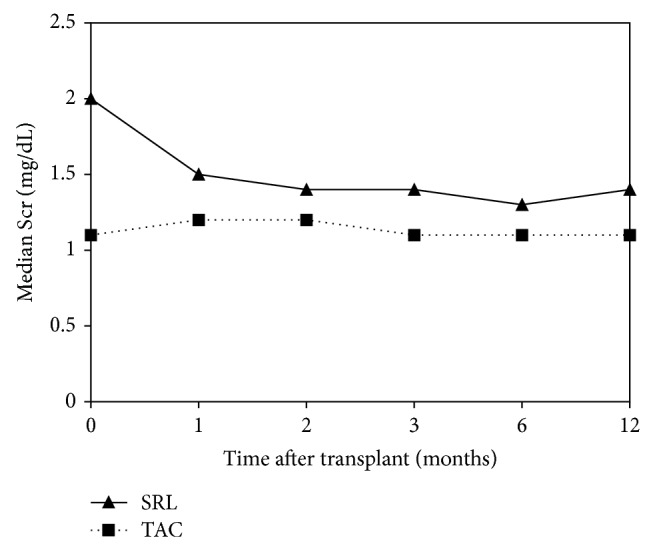
Comparison of mean serum creatinine between SRL (n = 29) and TAC (n = 168) groups over 1-year follow-up after transplant (P < 0.05 at all time points).
Official websites use .gov
A
.gov website belongs to an official
government organization in the United States.
Secure .gov websites use HTTPS
A lock (
) or https:// means you've safely
connected to the .gov website. Share sensitive
information only on official, secure websites.
Comparison of mean serum creatinine between SRL (n = 29) and TAC (n = 168) groups over 1-year follow-up after transplant (P < 0.05 at all time points).