. 2015 Mar 4;4:e05472. doi: 10.7554/eLife.05472

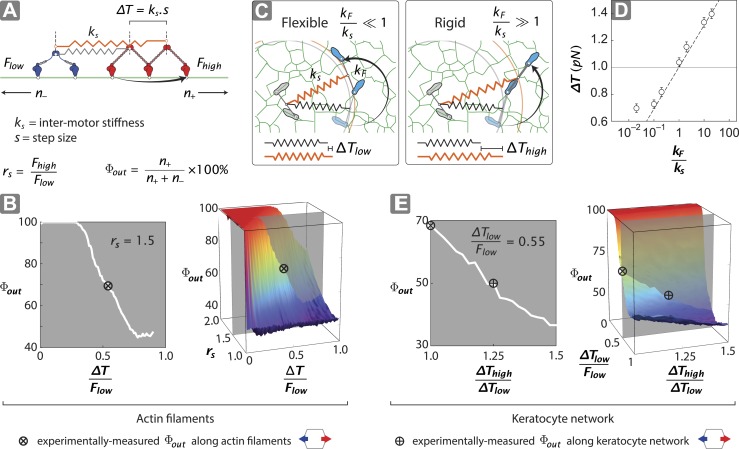
Figure 5. Stall force ratio, actin architecture, and myosin rigidity together tune directional flux.

(A) Minimal model of coupled myosin V (red) and myosin VI (blue) movement on an actin filament (green). The net compliance in the coupled system is modeled as a simple harmonic spring with stiffness ks. Each motor takes either a forward or backward step, based on whether the inter-motor tension after the step (T) is below or above the stall force (Flow − myosin VI; Fhigh − myosin V). (B) Outward flux of the mixed-motor ensemble (Φout) on single actin filaments as a function of the normalized inter-motor tension per step (∆T/Flow) and stall force ratio (rs = Fhigh/Flow). Based on previously reported stall forces for myosin V (Mehta et al., 1999; Uemura et al., 2004) and VI (Rock et al., 2001; Nishikawa et al., 2002; Altman et al., 2004), rs = 1.5 and is indicated by the gray shaded region (left). The corresponding experimentally measured Φout (⊗; Figure 2) and rs = 1.5 yield a ∆T/Flow = 0.55 ± 0.01. (C) Schematic forward step of a myosin with flexible (left) or rigid (right) lever arm on a digitized keratocyte actin network (green). The motor domains of the stepping motor (light blue shoes), non-stepping motor (gray shoes), lever arms, inter-motor linkage (pre-step—black spring; post-step—orange spring), and digitized actin network are drawn approximately to scale. The forward step results in an increase in both the inter-motor tension (∆T ks) and the intra-motor torsion (τ kF). A flexible forward stepping motor (kF/ks << 1) minimizes inter-motor tension (∆Tlow). A rigid forward stepping motor (kF/ks >> 1) minimizes intra-motor torsion (∆Thigh). (D) Simulated ∆T as a function of kF/ks. Varying lever arm rigidity (kF/ks) is sufficient to modulate ∆T. (E) Outward flux of the mixed-motor ensemble (Φout) on the keratocyte actin network as a function of the relative tension per step of the two motors (∆Thigh/Tlow). Gray shaded region (left) indicates the parameter space for ∆T/Flow = 0.55 ± 0.01 (see B). The corresponding experimentally measured Φout (⊕; Figures 2, 3) yields a ∆Thigh/Tlow = 1.20 ± 0.05. This enhanced ∆T for rigid motors evens out the competition on a branched 2D network compared to single filament tracks.

DOI: http://dx.doi.org/10.7554/eLife.05472.010

Figure 5.

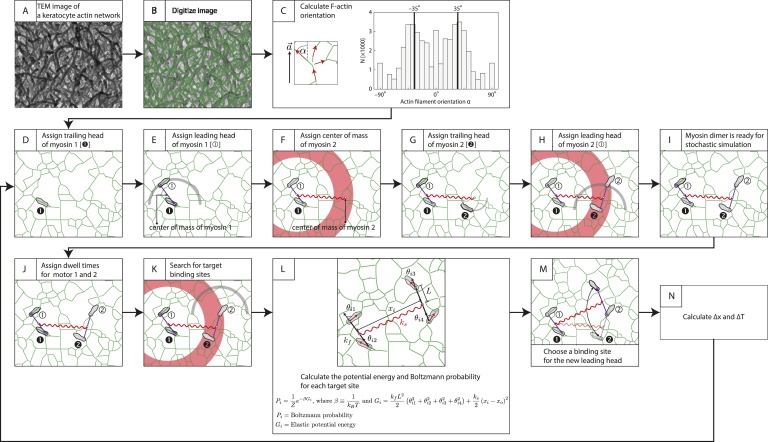
Figure 5—figure supplement 1. Description of stochastic simulation.

Figure 5—figure supplement 1.

Stochastic simulations for myosin-scaffold movement along an actin network were performed in Mathematica based on the following rules (Hariadi et al., 2014). (A) TEM image of a keratocyte actin network (Hariadi et al., 2014). (B) To investigate the influence of network structure to the stepping dynamics (Figure 5—figure supplement 2), the TEM image in (A) was first scaled by a factor of 0.5–1.25. The image was then skeletonized to derive the position of actin filaments (green lines) as described in Sivaramakrishnan and Spudich (2009). Every pixel is a possible binding site for a myosin motor head. (C) Next, we calculated the orientation of each actin filament relative to the polarity field vector for each pixel in the digitalized image. A 7 × 7 box was centered over each pixel, and based on the skeletonized filament in the search box each pixel was fit to a linear function. The local filament direction was then calculated by taking the inverse tangent of this fit. Pixels that fit poorly (R2 < 0.25) were excluded (14% of the detected pixels in [B]) from the simulation. The energy for each binding site was calculated from these filament directions (see L). For our model, the myosin pair consisted of either two identical myosin dimers with lever arm stiffness kF. Each myosin dimer has two motor domains (gray sandals), and each myosin pair is linked through their centers of mass by a linear spring ks. Finally, in each myosin a leading (① or ②) and a trailing head is indicated. (D) Motor 1's trailing head is placed randomly on an actin filament. (EH) The position of the leading head (E) and the second myosin (FH) are randomly assigned with only two restrictions. First the inter-motor distance between myosin heads must be 36 ± 7.2 nm (gray arc; [E and H]). Second distance between the centers of mass of a motor pair must be 65 ± 15 nm (red ring; [F and H]). (I) The position of all motor heads, the centers of mass for each myosin dimer, and the center of the two centers of mass are tracked during each simulation step. (J) Myosin V and VI dimers step stochastically on actin filaments with exponentially distributed dwell times. In our simulations, an exponential distribution of mean dwell times based on the cycle rates of myosin V and VI (De La Cruz et al., 1999, De La Cruz et al., 2001) was used to derive the dwell times for each motor step. In this example, t1> t2 and myosin 2 moves first. (K) For a motor to step, the trailing head of motor (motor 2) pivots about the lead head and its binding site is determined by the following criteria: (a) The binding site must be 36 ± 7.2 nm pixel from the leading head (gray arc). (b) The new center of mass for stepping motor (motor 2) must be within 65 ± 15 nm (red ring) from the center of mass of the non-stepping motor (myosin 1). (c) The stepping myosin must proceed in a forward direction determined by the actin network polarity. (L) For each pixel meeting these requirements (i), the energy Gi and Boltzmann probability Pi are calculated. (M) A binding site for each new leading head is then stochastically choosen based on the calculated Boltzmann probabilities calculated in (L). (N) The change in inter-motor tension is then calculated (∆T = ∆Tpost − ∆Tpre). The simulation was repeated for ≥400 times. The tension change ∆T was quantified and presented in Figure 5D, Figure 5—figure supplements 2, 3.
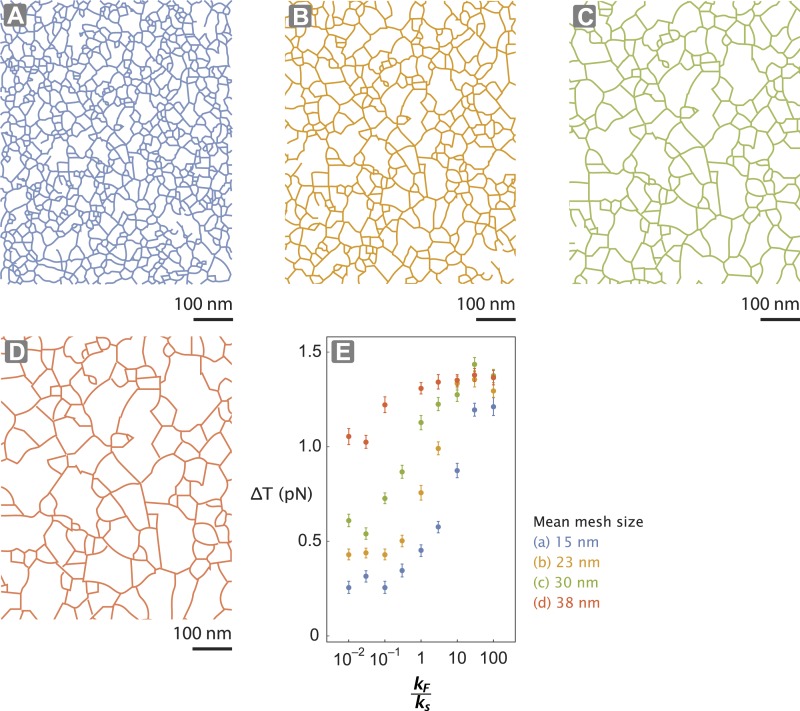
Figure 5—figure supplement 2. Actin network pore size alters tension generated.

Figure 5—figure supplement 2.

(AD) The interlaced actin network used in the stochastic simulation (Figure 5D–E and Figure 5—figure supplement 1). The network is generated by scaling a skeletonized TEM image of the keratocyte actin network by a factor of 0.5 (A—blue), 0.75 (B—orange), 1 (C—green), and 1.25 (D—red) (Figure 5—figure supplement 1). Given the mean pore size of the meshwork in the unscaled image (panel C; ∼30 nm (Svitkina and Borisy, 1998)), the mean mesh size of the generated networks is estimated to be 15 nm (A), 23 nm (B), 30 nm (C), and 38 nm (D). (E) For realistic flexibility of motor kF / ks < 10, tension generated per step (∆T) of myosin with kF / ks = 0.01–100 is influenced by the network structure. In these simulations, the inter-motor stiffness was set to 0.05 pN/nm.
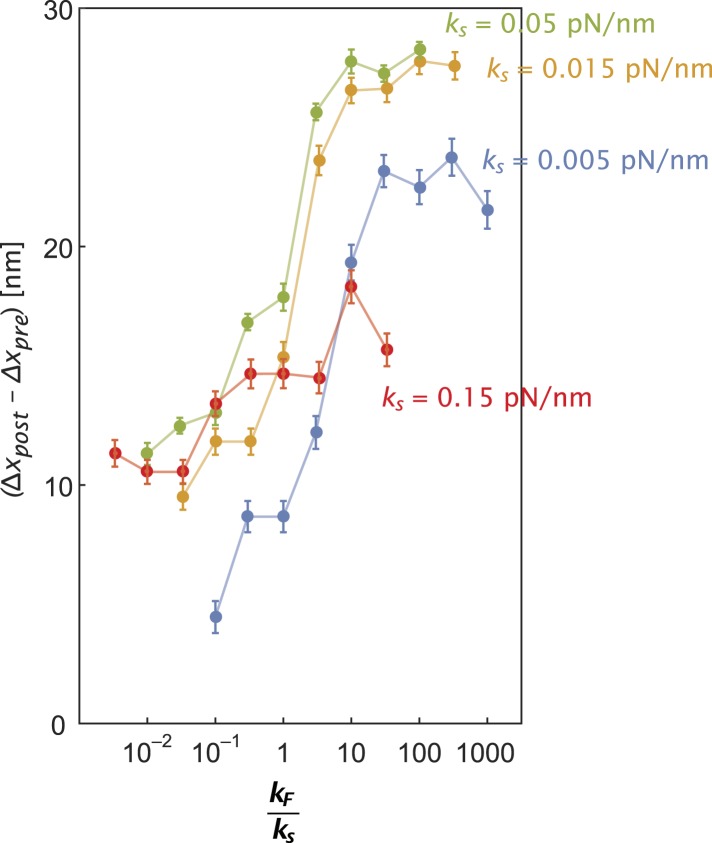
Figure 5—figure supplement 3. Inter-motor stiffness influences inter-motor tension.

Figure 5—figure supplement 3.

Change in the inter-motor distance (∆xpost − ∆xpre = ∆T/ks) for the simulated steps of two myosin motors (Figure 5—figure supplement 1) with flexural rigidity kF, connected by an inter-motor spring of varying stiffness (ks = 0.005 (blue), 0.015 (orange), 0.05 (green), and 0.15 (red) pN/nm).